Profiling with SourceKon
Watch the Artemis AI video tutorial on getting started profiling your projects with SourceKon here: Profiling your first Python project with SourceKon
SourceKon Overview
SourceKon is a tool developed by TurinTech for unifying the output of popular code profiling tools into a standard format which can be uploaded to Artemis. SourceKon currently supports the following tools and languages:
| Tool | Type | Supported Languages |
|---|---|---|
| Intel VTune | Profiler | C, C++ |
| Speedscope (with PySpy) | Profiler | Python |
| PyLint | Linter | Python |
| Flake8 | Linter | Python |
| SonarQube | Code Security and Quality Analysis | See the SonarQube docs |
| Coverity | Code Quality Analysis | Java, C/C++, C#, JavaScript, Ruby, Python |
Download SourceKon
Download the archive file from the downloads page
Installation
From within your extracted SourceKon directory create a new virtual environment for SourceKon.
python3 -m venv .venv
source .venv/bin/activate
Install SourceKon using the wheel files provided.
python3 pip install --no-index --find-links wheels/ sourcekon
Profiling Python Projects with Speedscope
The speedscope profiling tool uses speedscope in combination with pyspy to produce a profile of your Python project. You should identify
an entry-point for your project, like a benchmark or main.py, to run that you can use to profile your project code.
Run the SourceKon speedscope CLI tool as in the example below to generate a profile of your project.
sourcekon speedscope \
--project_path /path/to/projectdir \
--executable_path /path/to/entrypoint.py \
--output_path /path/to/outputdir
Troubleshooting
Empty Output File
If there are no snippets in the constructs section of the output file try running the py-spy command from the SourceKon output in isolation. You may have issues with your py-spy installation or build environment that are causing py-spy to fail silently in the background. For example:
py-spy record --format speedscope -o /path/to/project/speedscope_4818402441975951541.json -- pytest -rxs path_to_project/tests/benchmark.py
Function in Output from Dependencies not Project Files
If you are seeing functions from your project dependencies in the output of speedscope instead of functions from your project code check to see if
your project directory contains a virtual environment directory - if it does try running SourceKon from another location and update the paths in the
command accordingly.
If the issue persists make sure you are using the local version of your project (if a PyPi or other public version of your project is available) by uninstalling it and reinstalling it with:
python3 -m pip uninstall project
python3 -m pip install -e . project_dir
Profiling C and C++ Projects with VTune
VTune is a tool from Intel which can be used to analyze source code to identify areas of your source code which contain bottlenecks or poor algorithm choices which we can go on to fix with Artemis.
To get started install VTune using the Install Intel® VTune™ Profiler guide on the Intel site.
Build your project with debug symbols, for example by running the following cmake commands within your project directory:
cmake -DCMAKE_BUILD_TYPE=Debug -B build -S ..
cmake --build build
Run the SourceKon vtune CLI tool as in the example below to generate a profile of your project.
sourcekon vtune \
--project_path=/path/to/project \
--executable_path /path/to/builtfile \
--output_path /path/to/outputdir/ \
--vtune_path /opt/intel/oneapi/vtune/2025.0/bin64/vtune \ # Change to match your own VTune location
--build_command "exit 0"
Find the generated profile in the /path/to/outputdir/ it will be called something like artemis-compatible_vtune_project.json and the contents should look something like:
{
    "tool": "vtune",
    "constructs": [
        {
            "message": "Function forward found",
            "category": [
                "PROFILER",
                "VTUNE",
                "FUNCTION",
                "RANK 1",
                "RANK 1-10"
            ],
            "start_line": 181,
            "end_line": 220,
            "start_column": 5,
            "end_column": 26,
            "message_id": null,
            "file_path": "src/transformers/models/bert/modeling_bert.cpp",
            "time": 62.22999999999619,
            "language": "C"
        }, ...
    ],
    "context": {},
    "score": null
}
Troubleshooting
Empty Output File
If there are no snippets in the constructs section of the output file try running the VTune command from the SourceKon output in isolation. You may have issues with your VTune installation or build environment that are causing VTune to fail silently in the background. For example:
opt/intel/oneapi/vtune/2025.0/bin64/vtune -user-data-dir=/home/user/project/vtune-output -source-search-dir /home/user/project -collect hotspots -- /home/user/project/build/test all
Scope of ptrace system call is limited
If you see an error when executing VTune commands like:
vtune: Error: Cannot start data collection because the scope of ptrace system call is limited. To enable profiling, please set /proc/sys/kernel/yama/ptrace_scope to 0. To make this change permanent, set kernel.yama.ptrace_scope to 0 in /etc/sysctl.d/10-ptrace.conf and reboot the machine.
Set the ptrace scope and reboot with"
sudo vi /etc/sysctl.d/10-ptrace.conf
sudo reboot
Uploading results to Artemis Console
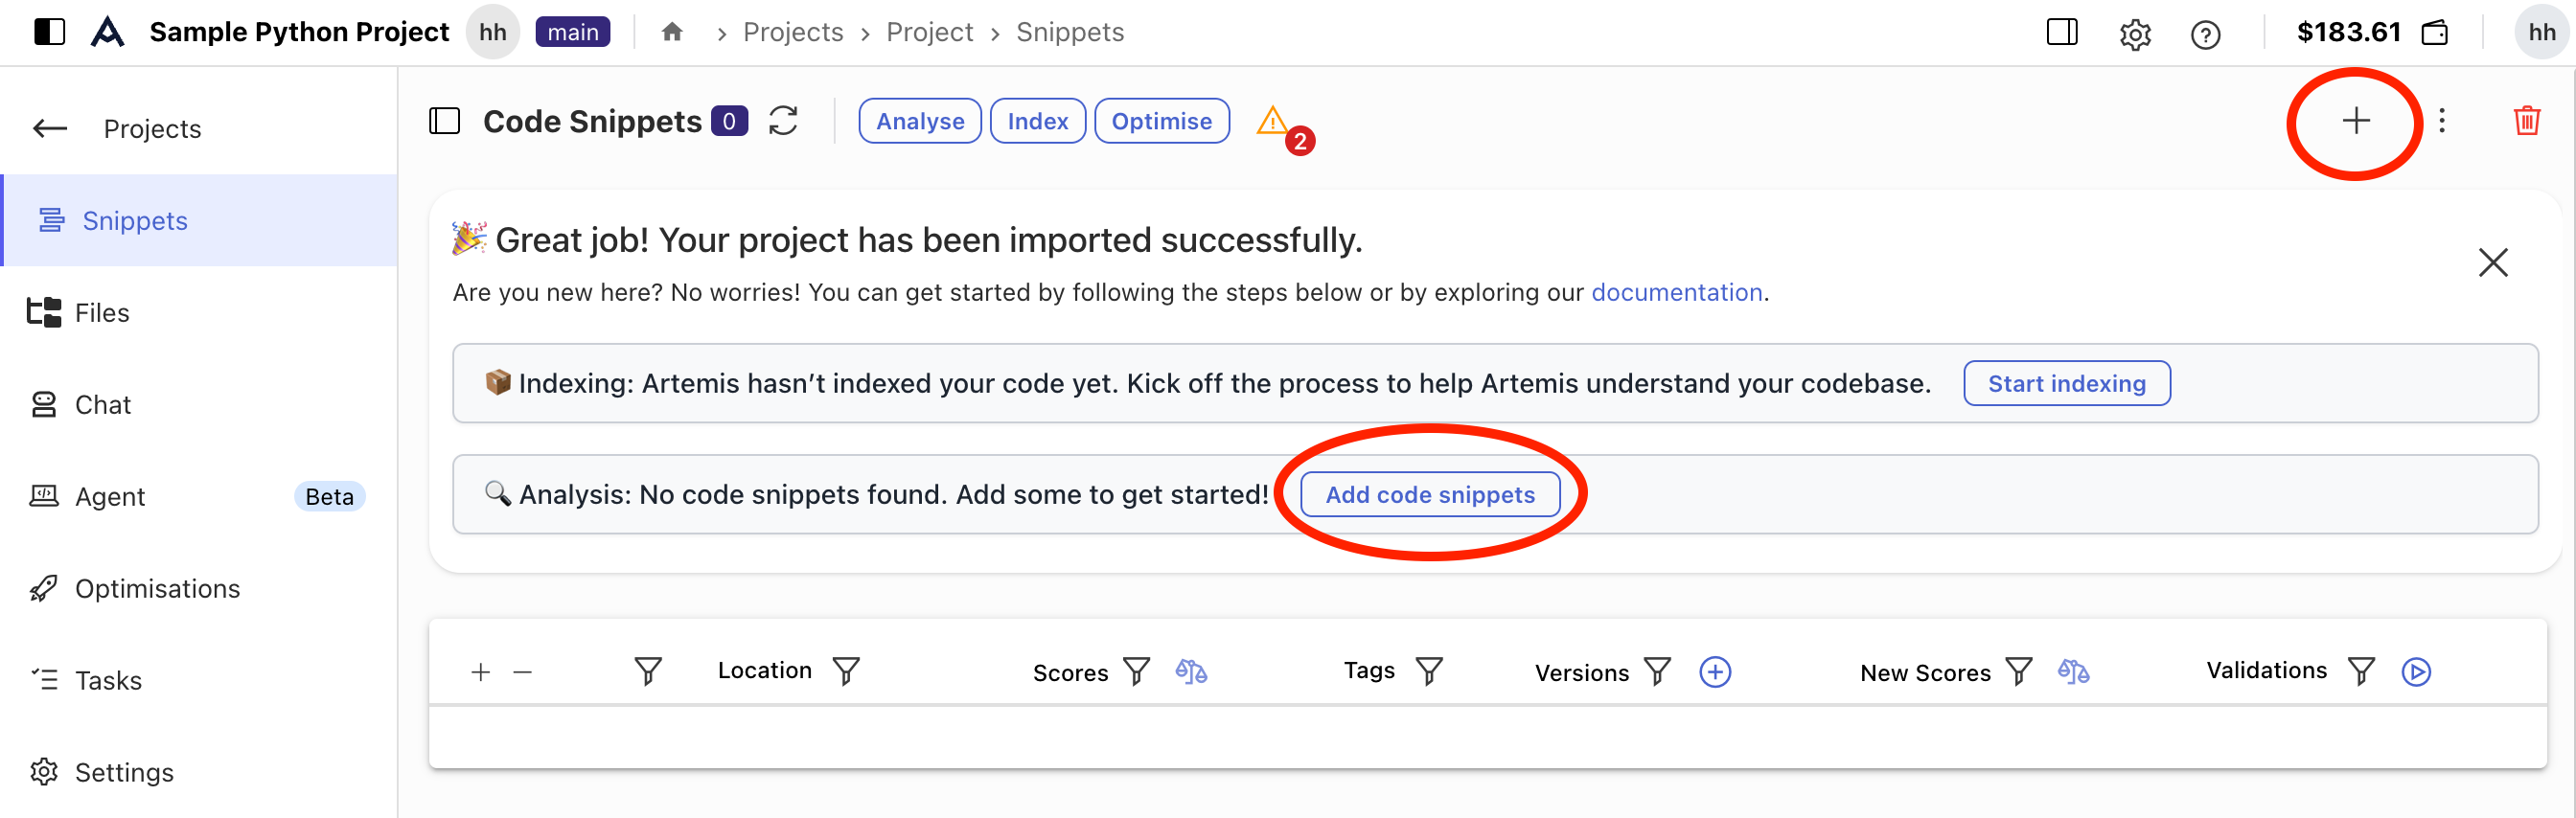
Once you have successfully profiled your project you can upload your profile to the Artemis Web Console from the snippets view * Home > Projects > Your Project * to bring the profiled code into your project as snippets.
Click on either the + or Add code snippets:
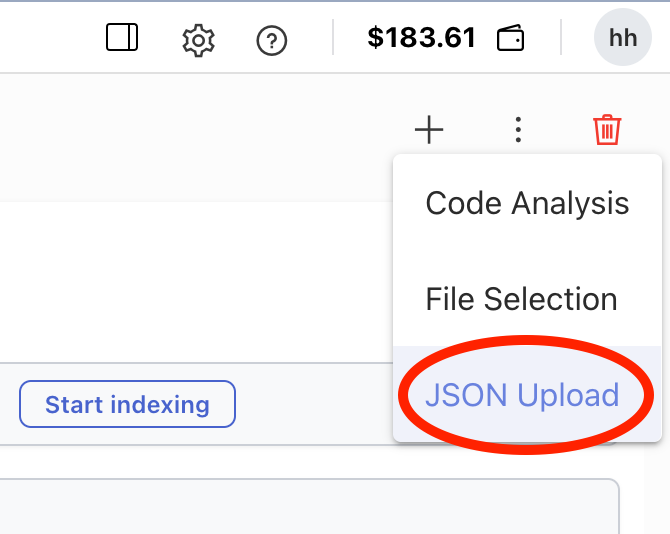
Click on the Json upload option:
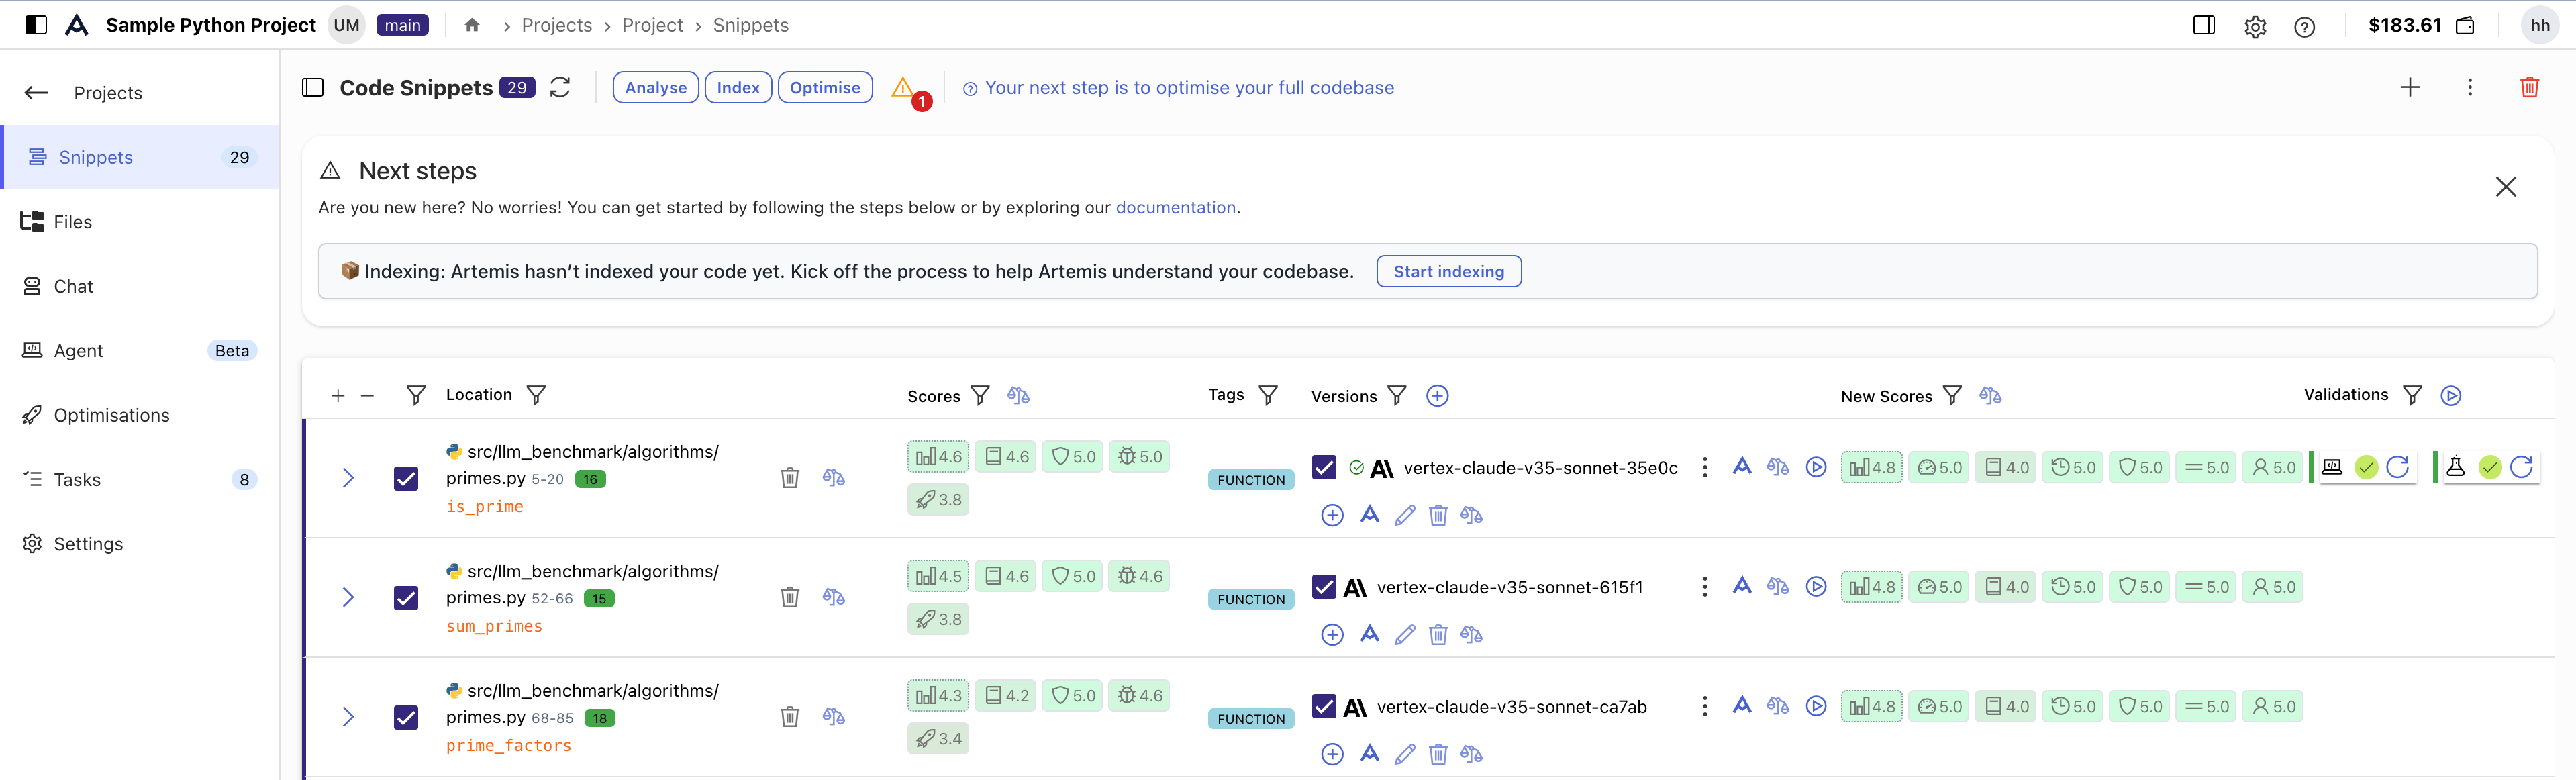
Upload your output file via the file explorer dialog or drag and drop the file to upload your project.

Once your snippets are loaded your project should look something like this:
Next Steps
Once you have uploaded snippets of code from SourceKon to Artemis, try to optimize them by Generating Code Recommendations.