Evolutionary Dashboard Development
A data scientist or a business analyst can use Artemis to generate a dashboard app for an existing ML project or pipeline, and then keep evolving parts of it against a measurable goal. Three things make this work well:
- Artemis reads the whole Project, so the dashboard can draw on several parts of a repository at once.
- Each Version is scored against your goal, so the dashboards improve as the run goes on.
- You can keep changing a generated dashboard afterwards, by hand or with an agent on its Branch.
We used Streamlit for the examples because it is Python-native and quick to run. Artemis does not care about the framework; React or any other UI stack works the same way.
How it works
Examples 1 and 3 use the same setup; example 2 has its own steps:
-
An empty app file in the repository, such as
streamlit_app.py. This is the file Artemis evolves. -
A data summary script (
data_structure.py) that prints the columns, types and ranges of your data. It runs as a Setup command of the Project's Script, so its output lands in the logs and the agent learns what the data looks like. -
A benchmark command that launches the Streamlit app for a few seconds, so each Version is validated on a Runner:
PORT=8505; fuser -k ${PORT}/tcp 2>/dev/null || truetimeout 5s streamlit run streamlit_app.py --server.maxUploadSize 100000 --server.port $PORTrc=$?; [ "$rc" -eq 124 ] && exit 0; exit "$rc"timeoutstops the app after five seconds, which is the expected outcome (exit code 124). Any other exit code, such as a crash on start, fails the Version. -
An Objective that describes the dashboard you want. Artemis turns it into scoring criteria, generates Versions of the app file, validates each one and carries the best forward. In the current platform this is a Discovery Run. A run can also use Review only instead of a Runner: then a panel of judge models scores each Version against the Objective, as in the second example below.
When the run finishes, open the best Version's Branch, publish it or download the code, and serve it locally with Streamlit.
Example 1: a dashboard for a finished ML project
The repository is a typical data science project: a data directory, notebooks for processing and analysis, a Python script that trains and evaluates the model, and the project configuration. We added the empty streamlit_app.py and the data_structure.py described above.
The project forecasts the year-over-year quarterly change in the labour cost index (LCI) from other macroeconomic variables. We wanted to see how the harmonised index of consumer prices (HICP) relates to the LCI across countries. The Objective, with the training script attached as context:
In this project I have built a supervised forecasting pipeline to predict the quarterly year-over-year change in the Labour Cost Index (LCI) one to several quarters ahead. The model ingests a multi-country, quarterly panel of macroeconomic indicators, amongst which the harmonised index of consumer prices. Generate a Streamlit dashboard from this file which answers the following questions: Does inflation lead wage inflation, according to my forecast? How quickly and by how much? Where is the pass-through strongest? Include components such as a dual-axis YoY HICP vs YoY LCI chart, cross-correlation charts or a lead-lag heatmap, and maybe a scatter with a fit line and slope by country.
The landing page of the best Version, served locally:
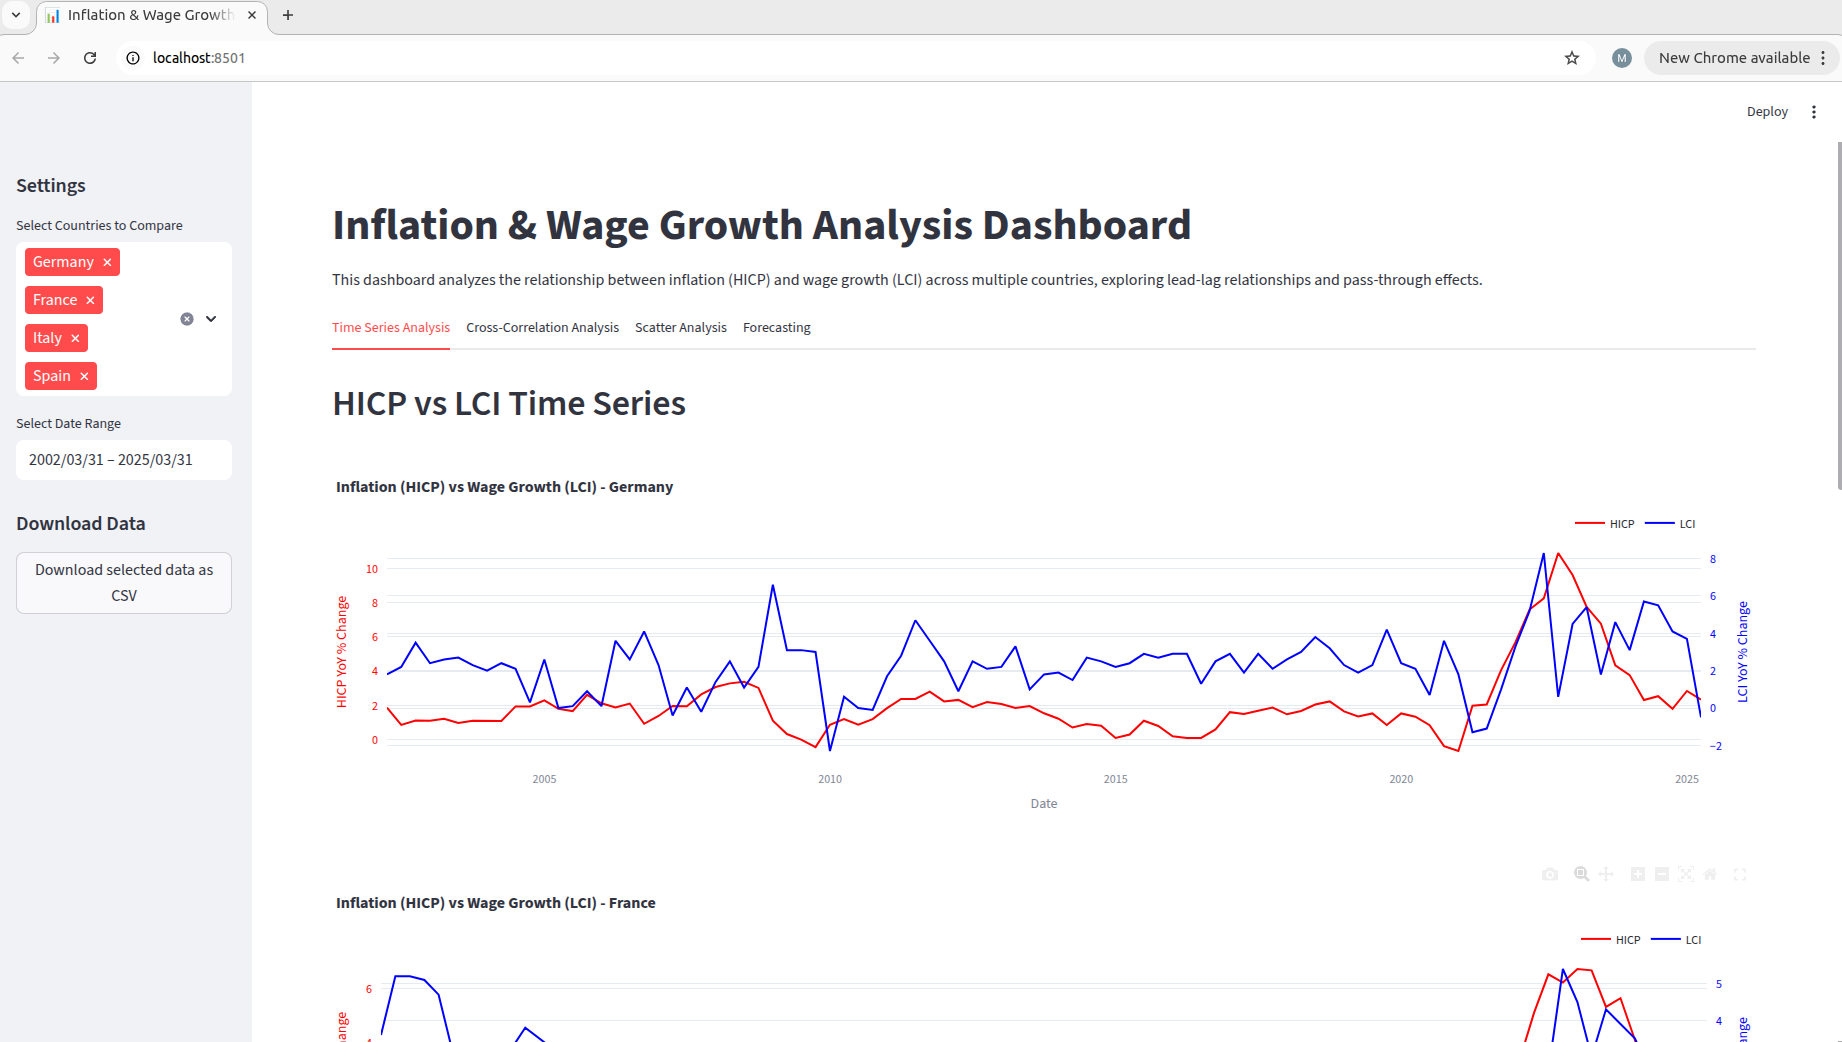
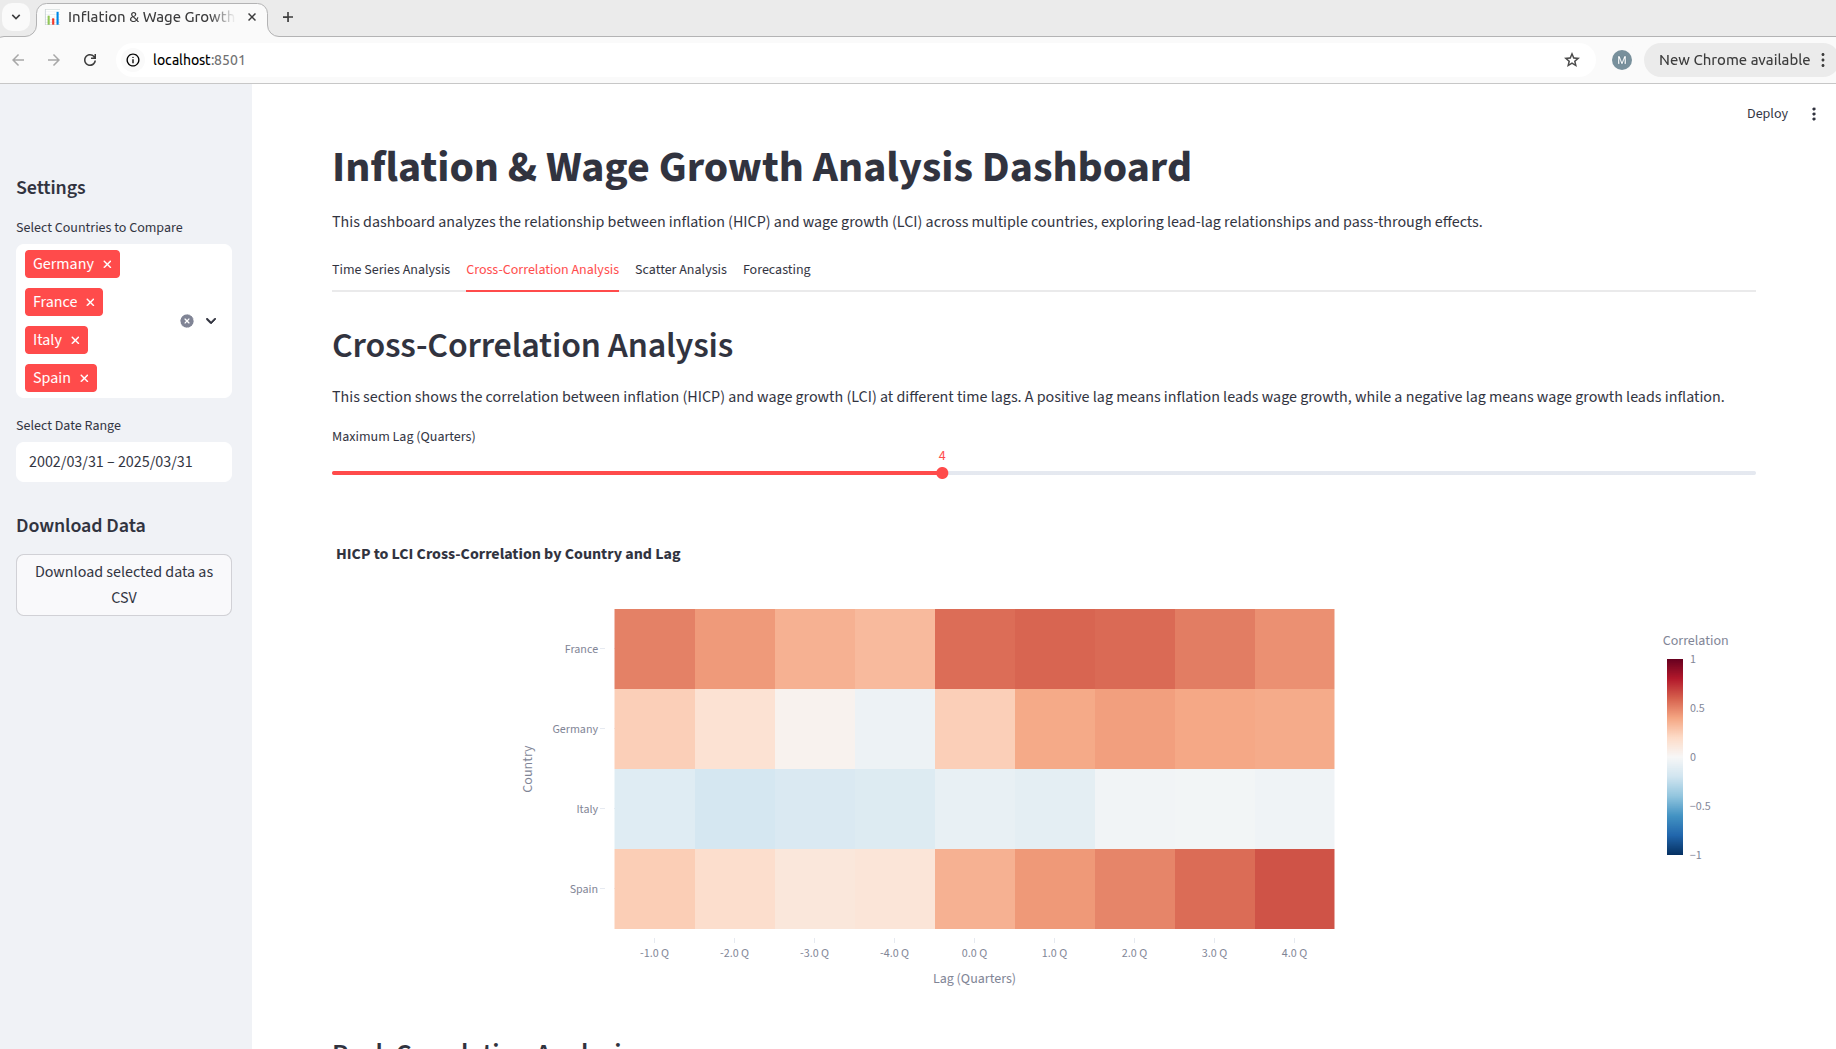
Artemis turned the questions in the Objective into the dashboard's sections. Because it had read the training script, it knew we had generated lags and a lead on the target, and it built that into the cross-correlation view:
Example 2: a compliance dashboard from an evoML pipeline
If you have your model's pipeline code, or you use evoML to produce it, Artemis can build a dashboard directly from the pipeline. We used this to check whether a model meets the EU AI Act and the SR 11-7 / OCC 2011-12 model risk management guidance.
-
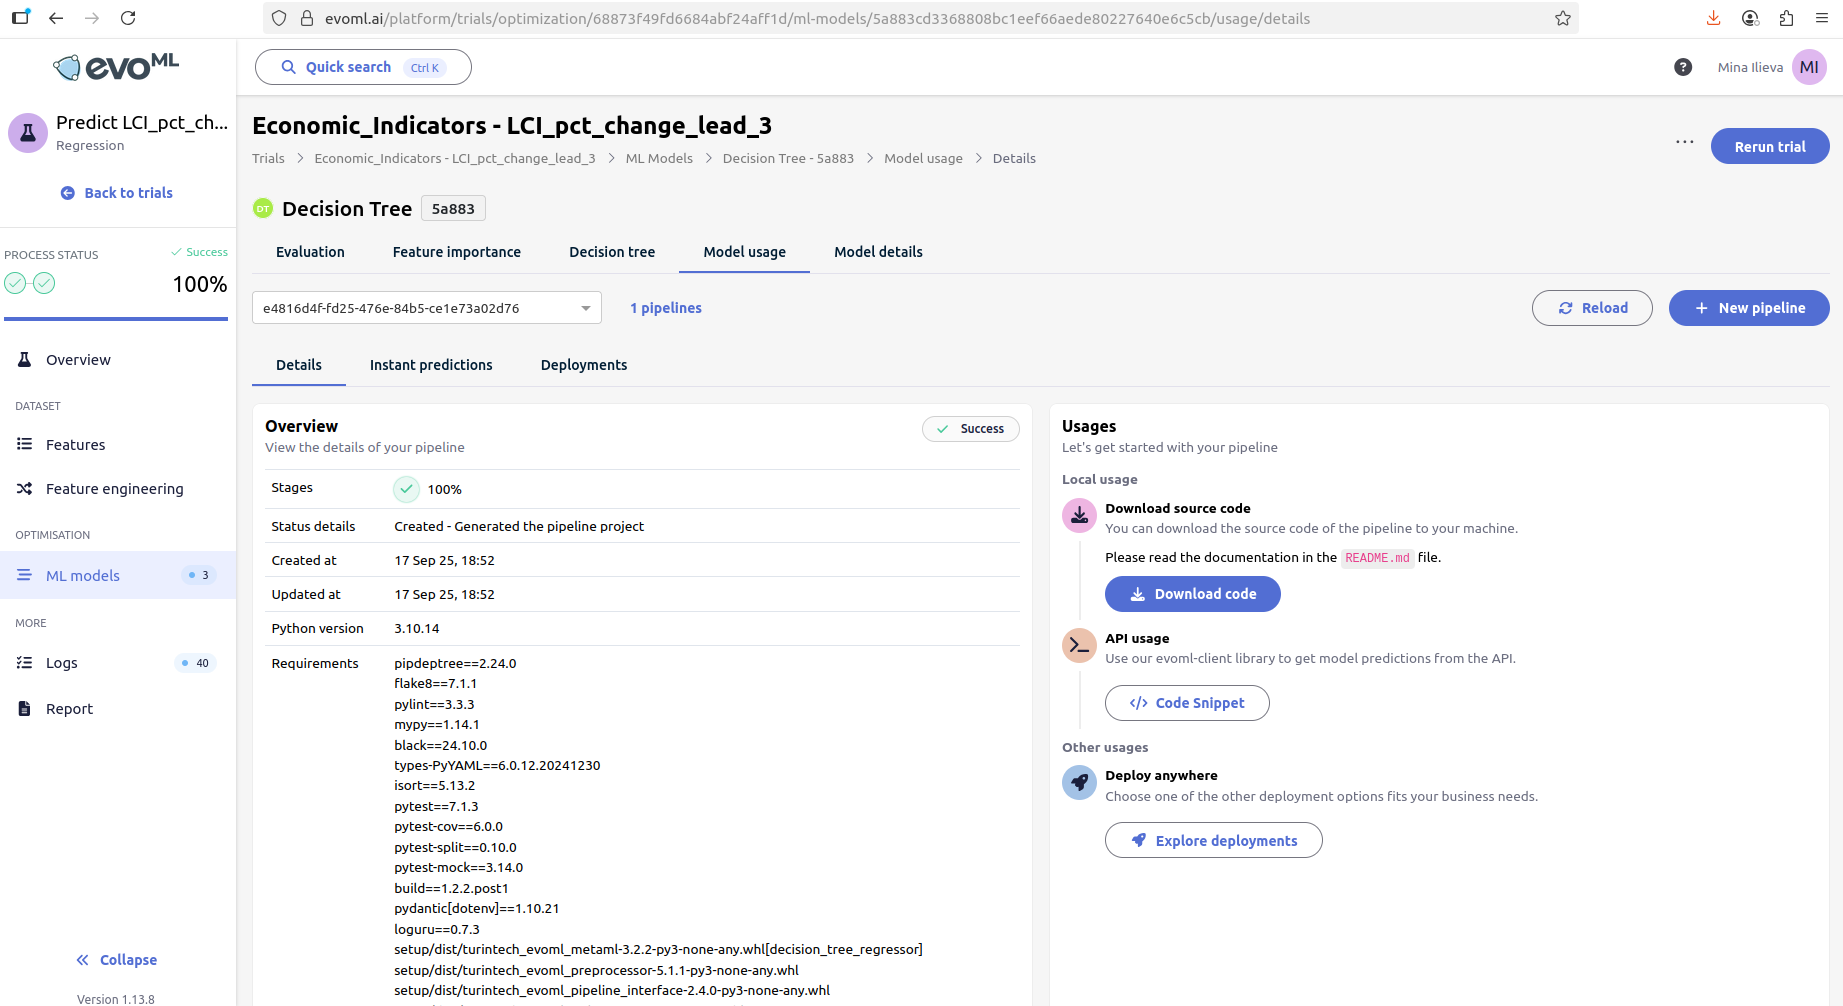
In evoML, open your model's Model usage tab and click Download code.
-
Extract the pipeline, add an empty Streamlit file (
app.py) and anArtemis.mdthat describes what each component of the pipeline does. Add anything else the dashboard should know about: deployment targets, data flow, integration points, security and compliance requirements. -
Add Streamlit and your plotting libraries to
pyproject.toml, zip the folder and upload it as a new Artemis Project. -
Give Artemis the Objective:
This entire repository represents a logistic regression model pipeline for a classification trial on a credit default risk dataset. You can find an outline of the folder structure in the commented-out section of the app.py file. I want you to evolve this app.py file to become a Streamlit dashboard which analyses the pipeline's compliance with the EU AI Act, focusing on aspects such as data validation, security, model deployment, documentation transparency and others. Remember that you have access to an LLM.
We generated 15 Versions with Review only, so the judge models scored them against the Objective. The best one:
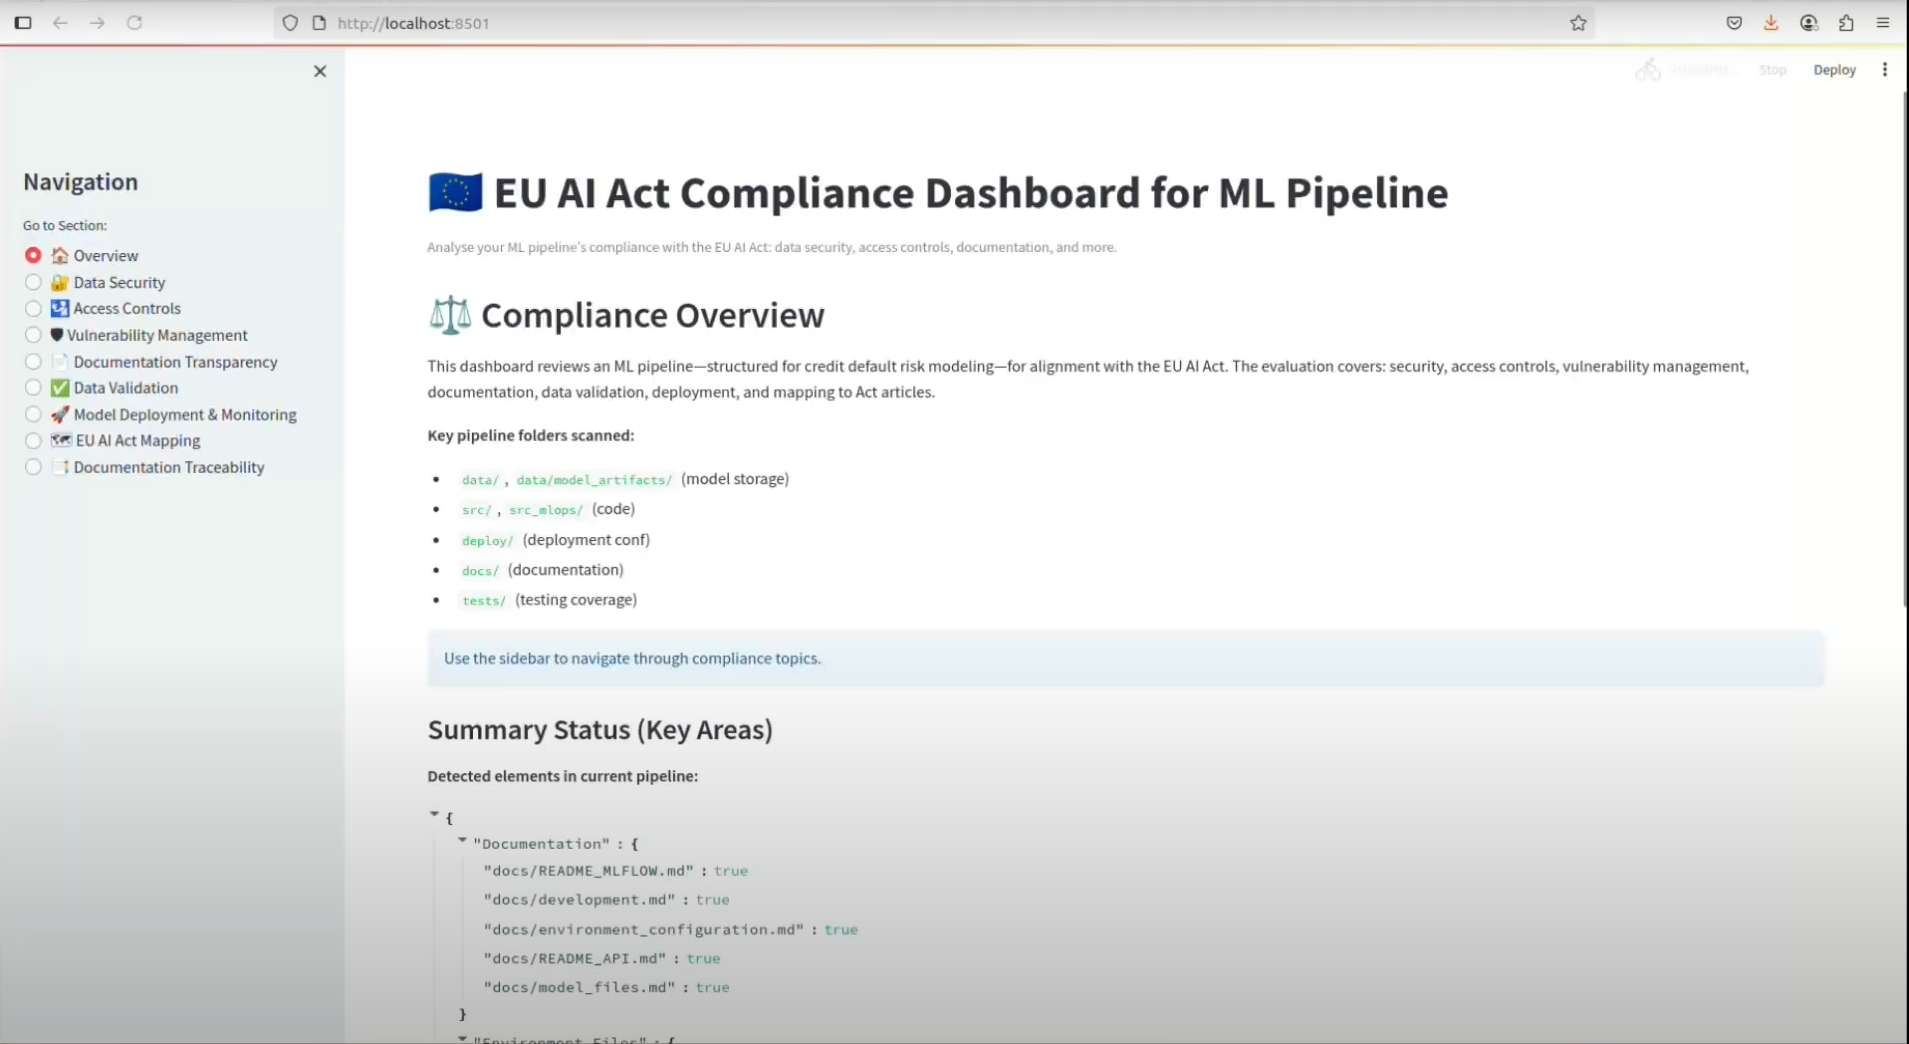
It is a compliance-readiness snapshot of the pipeline: the pipeline's structure gathered as evidence under eight pillars, each mapped to an EU AI Act obligation, with an overview page. Governance requirements differ between organisations, so treat it as a starting point and keep refining the Version on its Branch.
Example 3: evolving a dashboard component against a score
Artemis can also improve one component of an existing dashboard against a measurable KPI. In this example the component is an automatic email tagger. Artemis proposes the set of tags, and the score measures how well those tags fit a set of customer support emails.
Setup
The Project is a multi-page Streamlit app:
app.py, the entry pointpages/, the pages Streamlit renders; the page script Artemis evolves lives hereemails.csv, 200 simulated support emails with subject, body, tag and customer tierdata_structure.py, the data summary scriptembeddings.py, a wrapper around the OpenAI embedding model (text-embedding-3-small) and a ChromaDB vector storellm.py, a wrapper around the OpenAI SDK
You need an OpenAI API key in a .env file. The benchmark command launches the app with that file and gives it 20 seconds, the same pattern as the first example.
The score
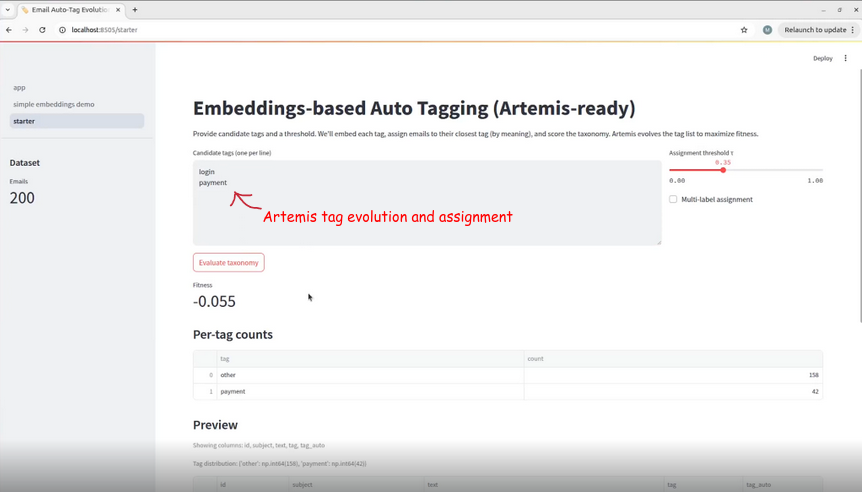
The page script loads the emails, joins subject and body into one text, embeds the texts and the candidate tags, and assigns each email to its closest tag by cosine similarity. An email whose best similarity is below the threshold τ (we used 0.35) is left as "other". The script then computes a fitness score:
fitness = avg_max_similarity - 0.3 × redundancy - 0.3 × unassigned_rate
avg_max_similarity: the mean, over all 200 emails, of each email's best similarity to any tagredundancy: the mean pairwise similarity between tags, which penalises overlapping tagsunassigned_rate: the fraction of emails below the threshold, which penalises tag sets that leave emails unclassified
After each run the script writes the score to artemis_results.json in the build directory, for example { "fitness": 0.400 }, so the fitness score is the measured Metric Artemis optimises. See Custom Metrics.
This is the page before the run, with two seed tags and a fitness of -0.055:
The Objective
This script uses an embeddings wrapper to convert email text and tag phrases into vector representations via an OpenAI embedding model. These embeddings are then used to compute a fitness score: avg_max_sim (how well tags match email content on average) minus 0.3 × redundancy (controls for duplicate or overlapping tags) minus 0.3 × unassigned_penalty (controls for emails that do not get tagged). Improve the seed tags in this script with insightful email tags to maximise email classification accuracy and coverage.
Results
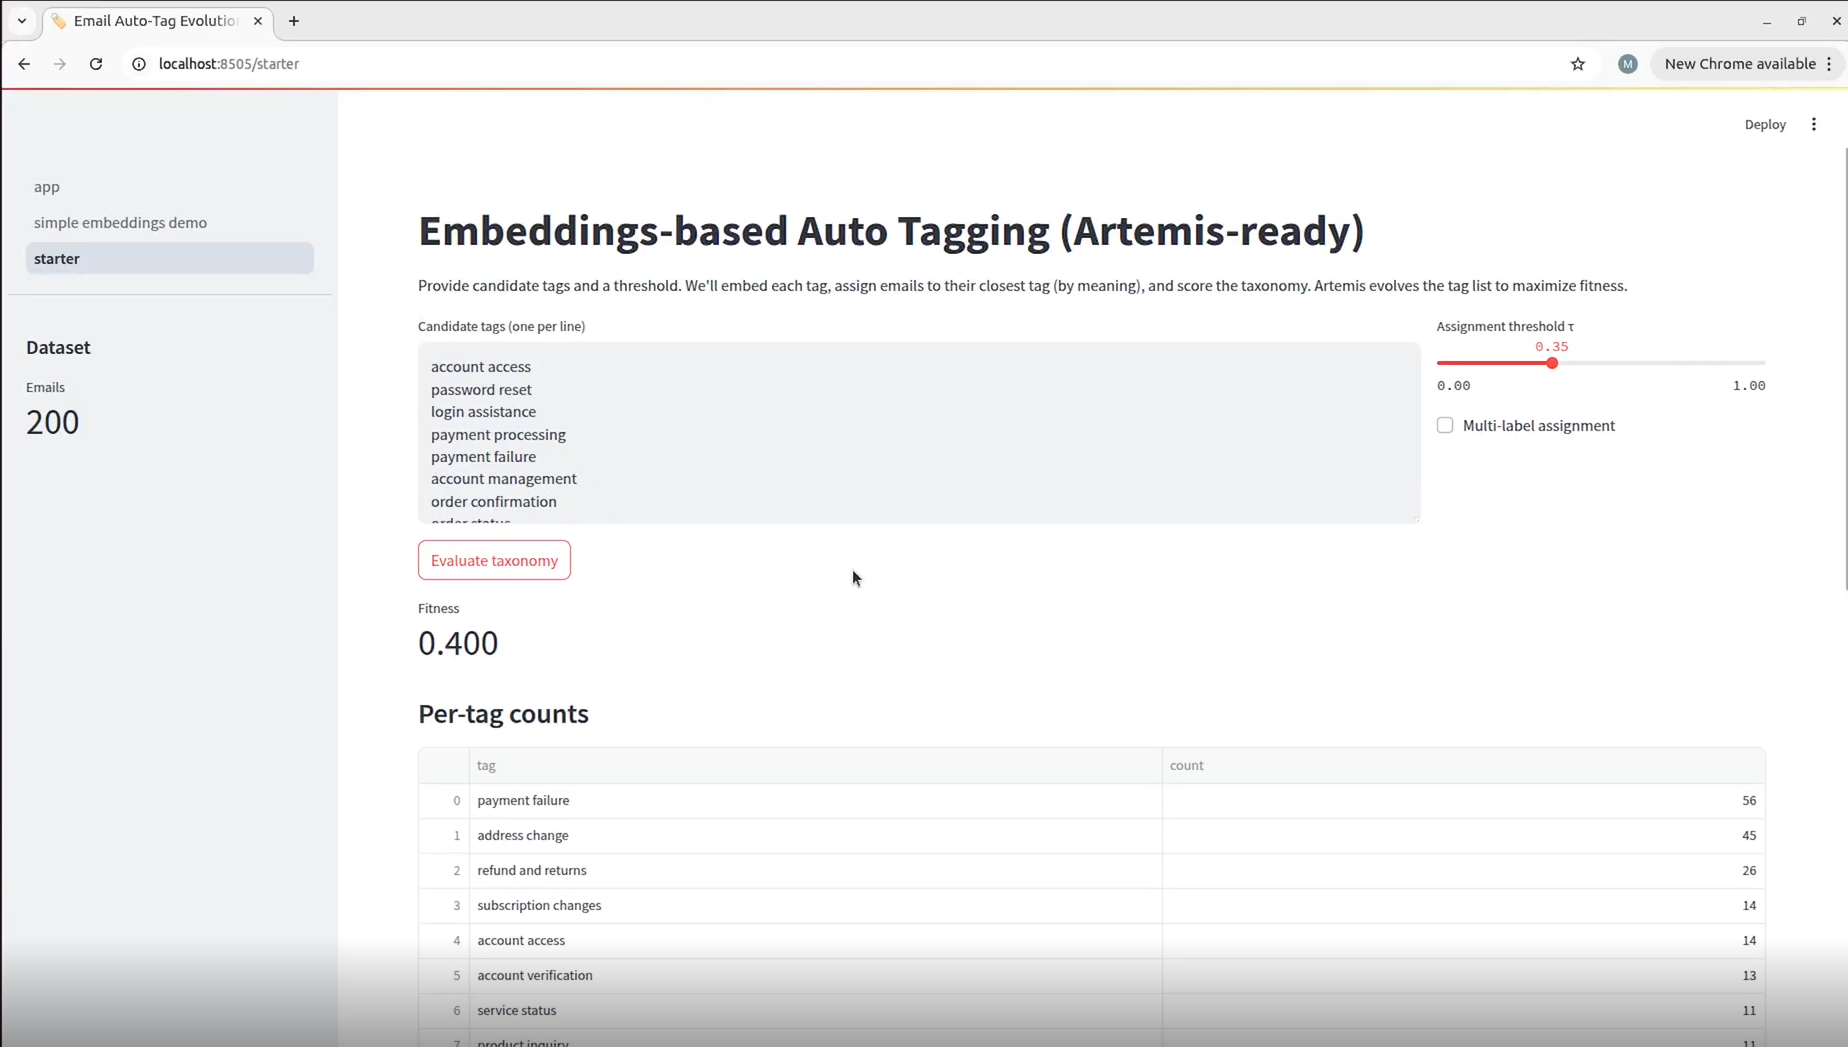
Artemis raised the fitness score from -0.055 to 0.400 by proposing specific, non-overlapping tags that cover the whole dataset: