Evolutionary Dashboard Development
Author: Mina Ilieva
Here we demonstrate how a data scientist or a business analyst can use Artemis Intelligence to rapidly generate dashboard apps and enhance either a pre-existing ML project or a pipeline, to create a dashboard on-the-go. The utility of using our genetic algorithm for quick dashboard creation is manyfold:
- Artemis directly considers your project environment, making it ideal for dashboards considering multiple architectural components of a repository.
- a goal-based optimisation of each variant for KPIs and hypotheses via its fitness function.
- the opportunity to tweak various components of your dashboard post-generation.
We chose Streamlit as our foundation for rapid dashboard generation. Its lightweight, Python‑native design and clear execution model make it easy to build and iterate on interactive components. However, Artemis is framework‑agnostic - if you prefer React or another UI stack, do not hesitate to use Artemis with your own setup!
1. Dashboard generation for your finished ML project.
Data scientists and business analysts frequently need to create dashboards to effectively communicate their analysis results with various audiences. To demonstrate this workflow, we have set up a typical data science repository with a clear separation of concerns, including:
- A data directory for storing datasets.
- Notebooks for data processing and analysis.
- A python script for model execution and evaluation.
- Project configuration files for dependency management and reproducibility.
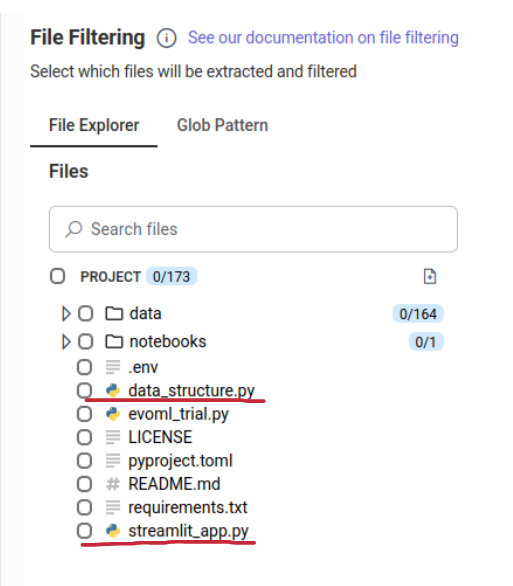
To prepare the Artemis environment for our setup, we just added the following files:
- an empty streamlit_app.py file (this is the file we will evolve with Artemis)
- a python script which loads our data and prints the output to be consumed by our runner (see below)
2. Project setup
2.1. Indexing Before generating the dashboard, index your project to enable Artemis to build a semantic understanding of your project's code (see Indexing).
2.2. Project Build Set up and activate an instance of your Artemis runner.
-
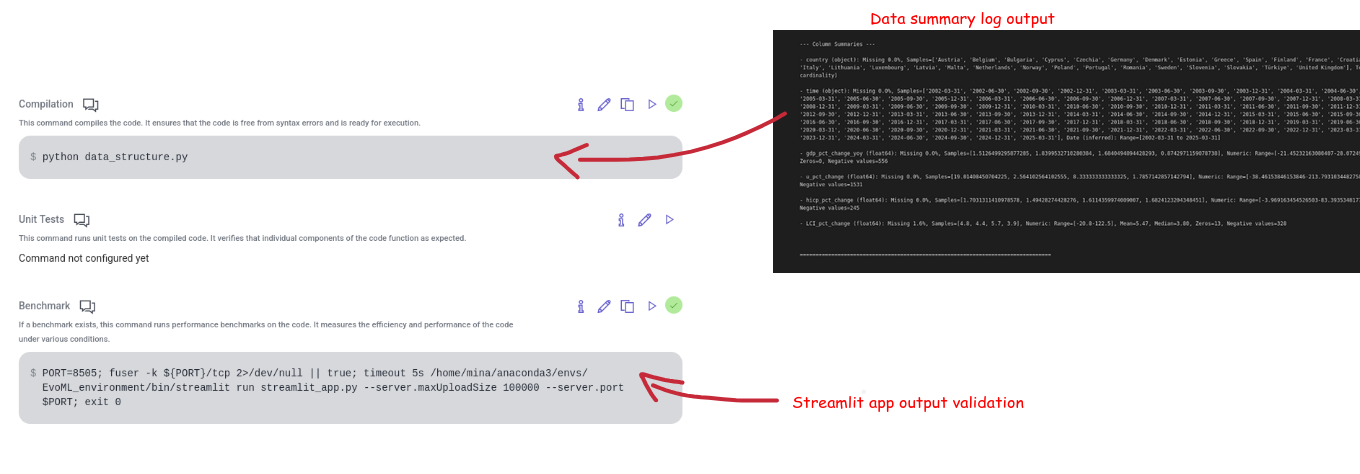
We run the script we created for our data summary within our compilation command. This command is only ran once and ensures our runner receives context to our dataset features - their types and properties. Tailor the data summary to the logs in whichever way you wish Artemis to understand it for the dashboard you will be working with.
-
We provide the path to our streamlit interpreter and run our streamlit instance as a benchmark command. That way we ensure that our runner validates each instance created for our app. You can experiment with the control you have over your dashboard generation config, if you are also using Streamlit.
3. Creating your Dashboard
Once everything is set up, you can start creating your dashboard with Artemis!
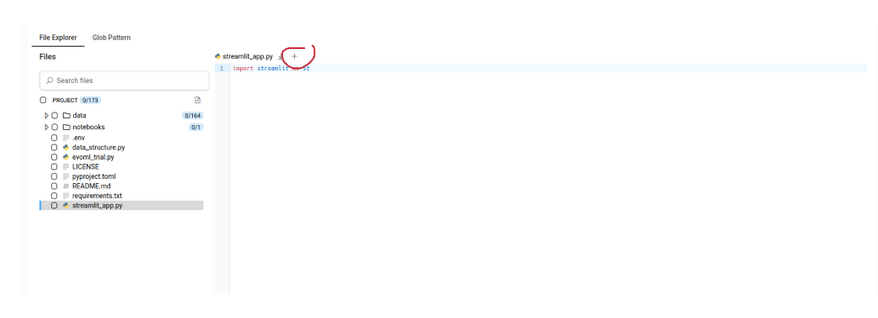
3.1. Create a code snippet from your empty file.
3.2. Provide Artemis Intelligence with your goal.
When you supply your prompt to the genetic algorithm for dashboard creation, it effectively serves as a global validation objective, defining the KPI by which candidate dashboard variants are evaluated, scored and selected.
For our project, we built models to forecast the year-over-year quarterly change in the labour cost index, as we supplied our model with other macroeconomic variables. There, we wanted to further understand and visualise the relationship between the harmonised index of consumer prices and the labour cost index, and how it varies across countries. Here we also provided our python script as context to the Artemis.
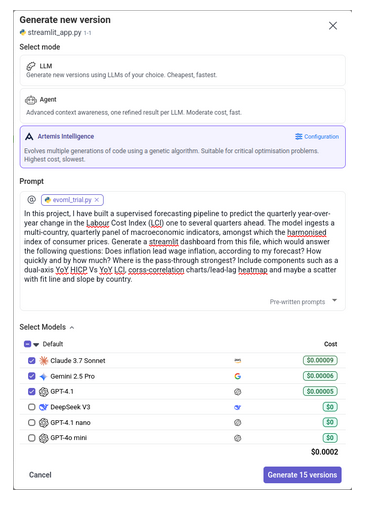
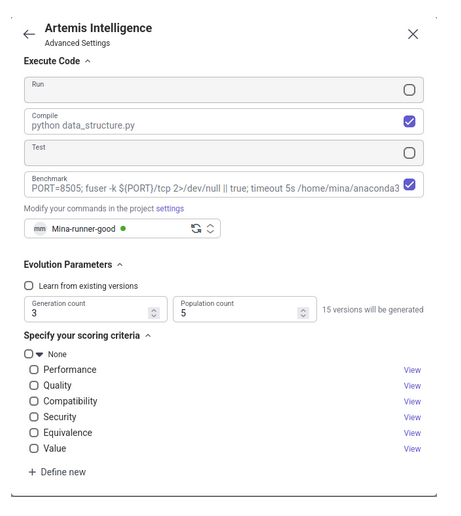
After writing up your task, enable the execution commands we specified above within your configuration settings (right). From there, you can also control the number of dashboard versions Artemis would generate for you. Once you're done, click 'generate'!
4. Output
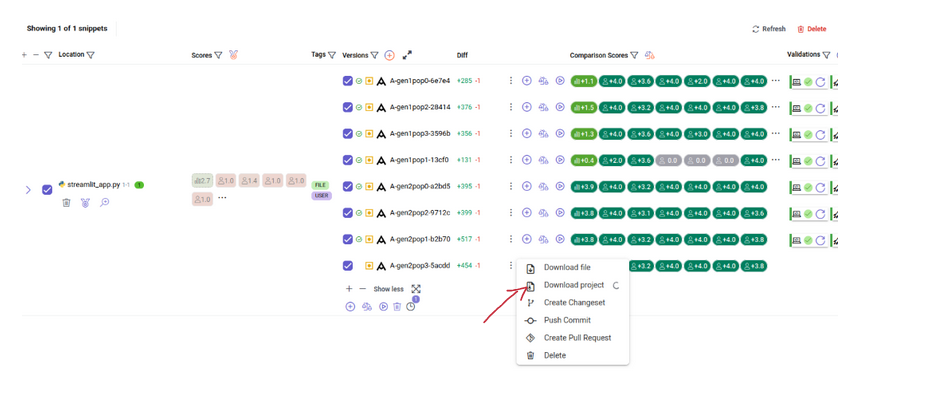
Once your recommendation trial has finished, you can download the top-ranked dashboard code variant by downloading the project entirely:
.. and serve it locally via Streamlit:
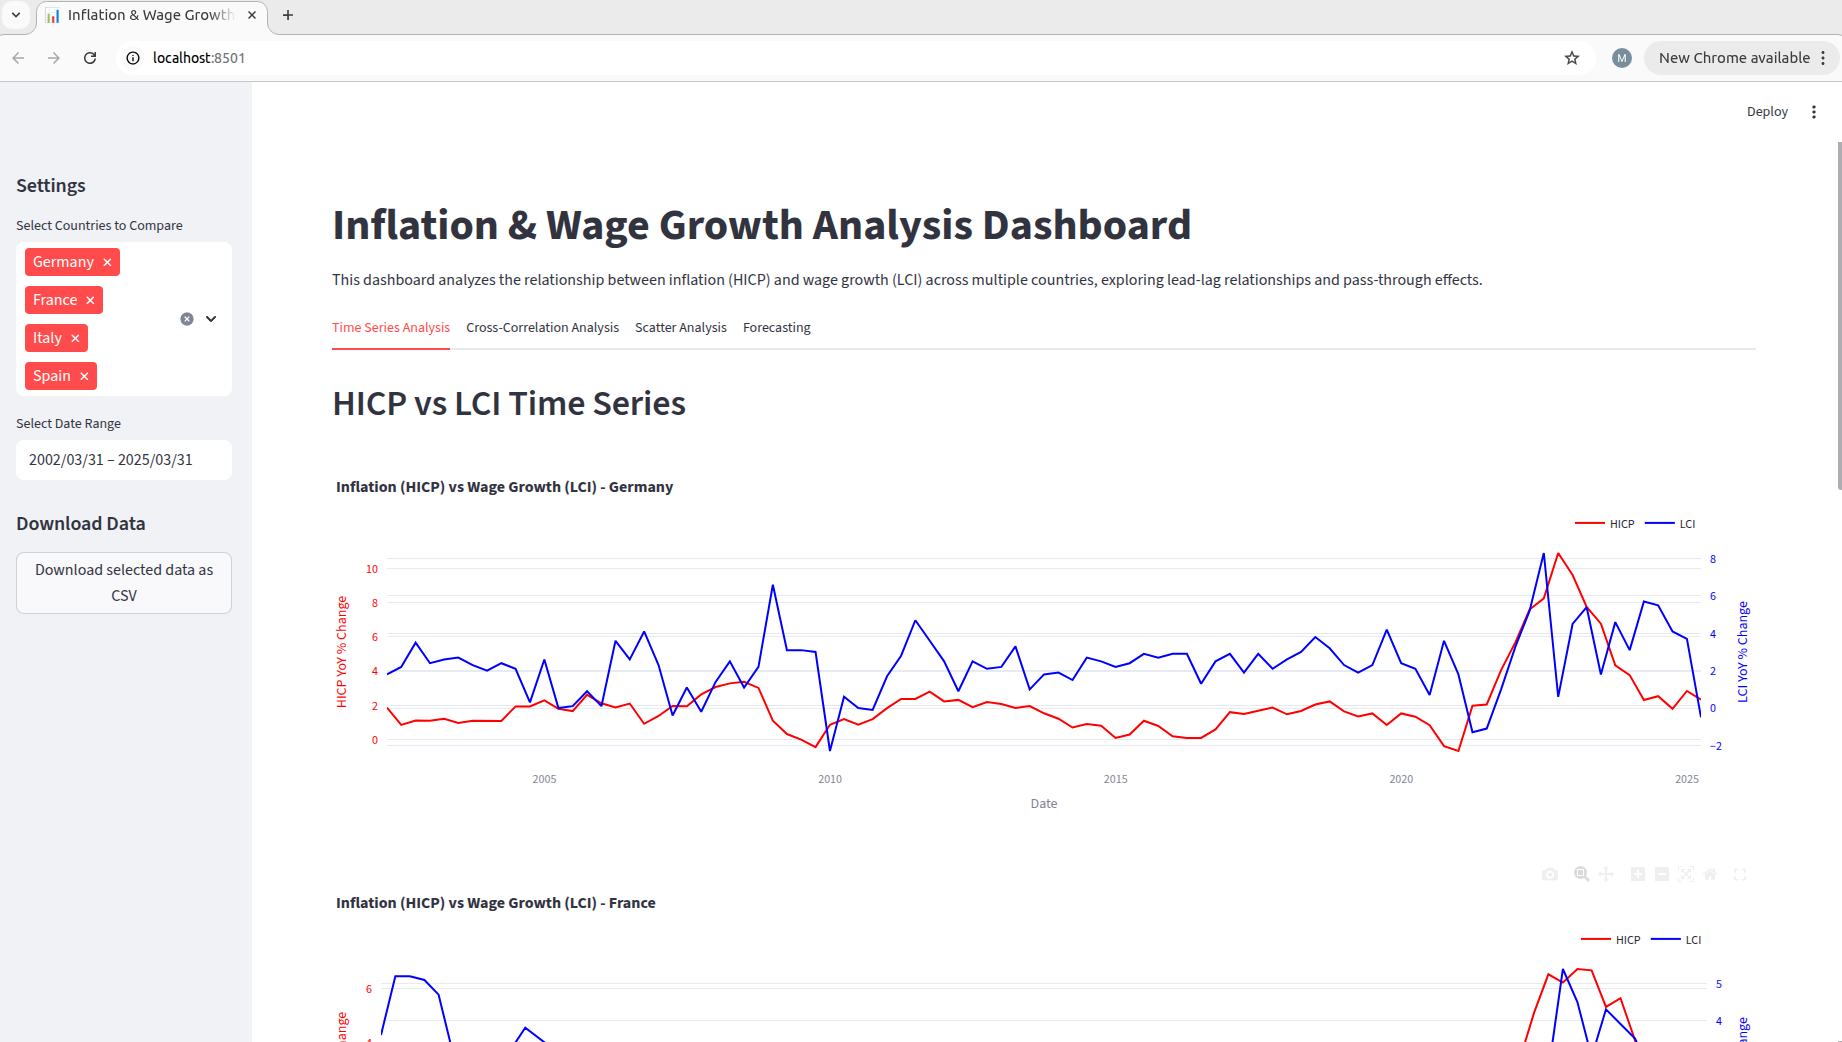
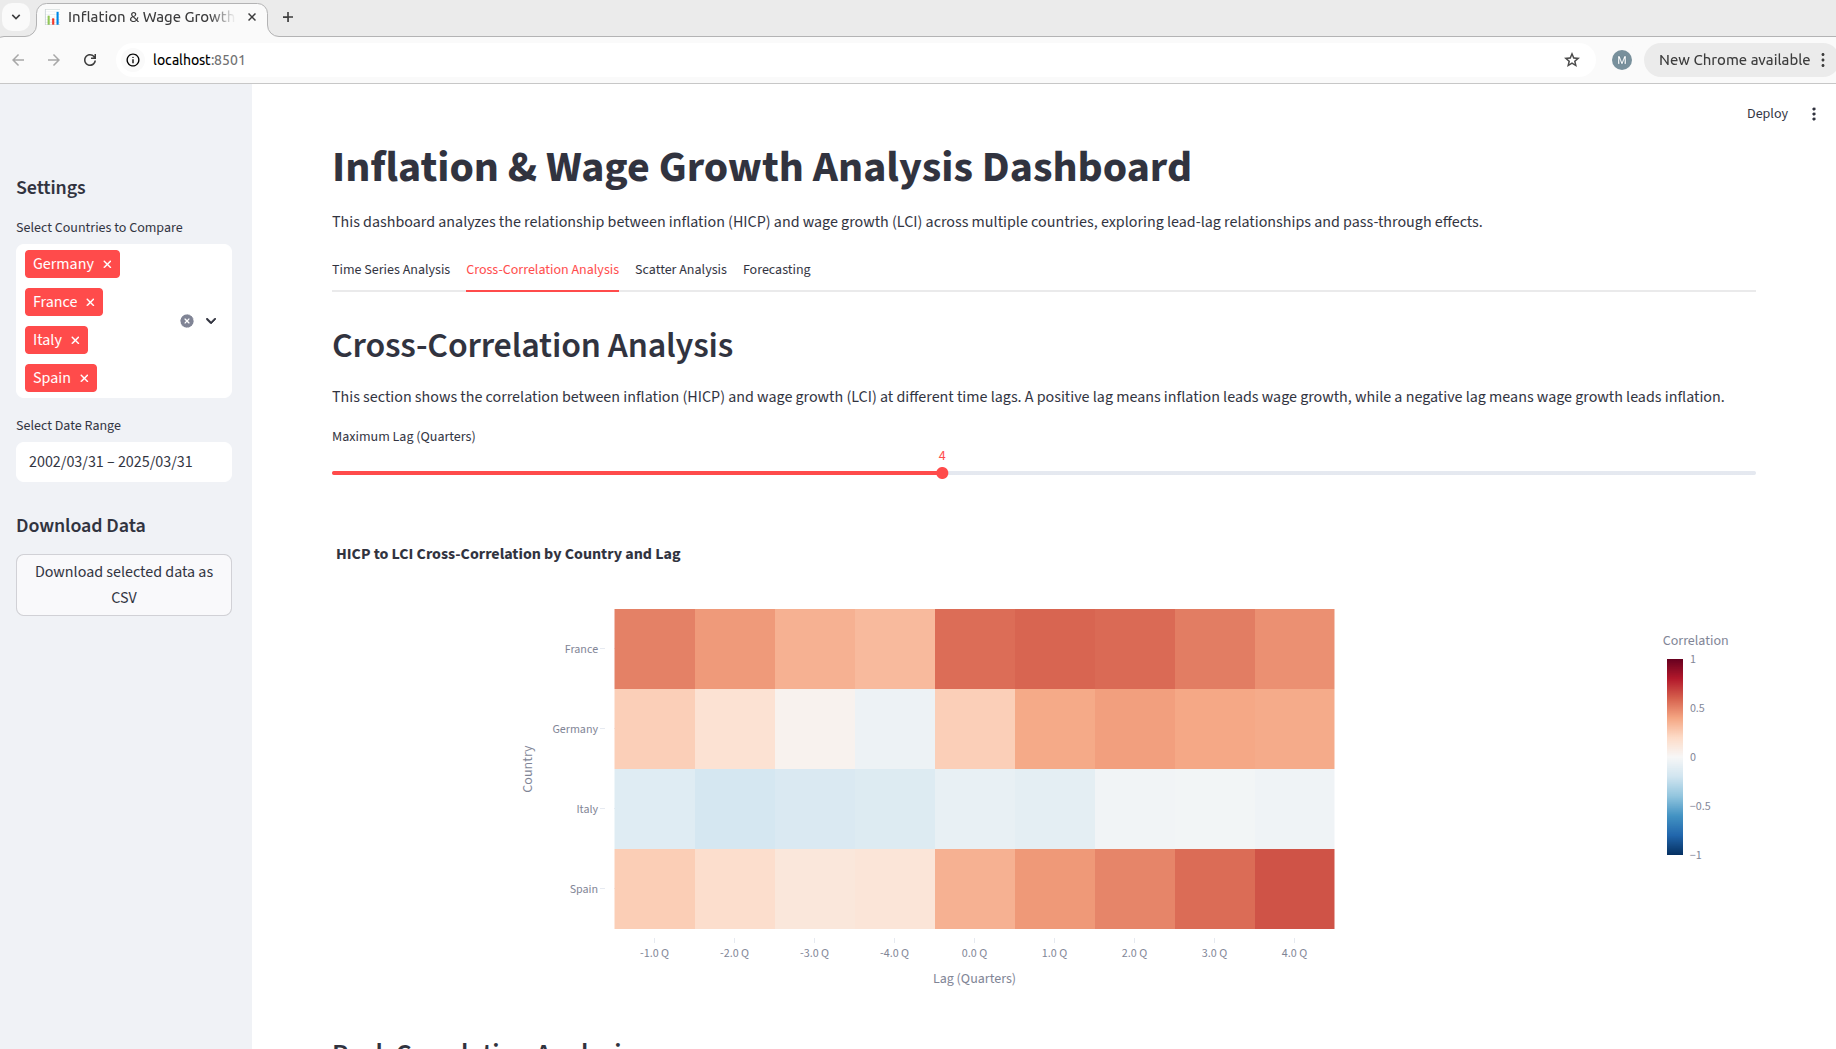
This is how the initial interface of our LCI forecast dashboard looked like - Artemis Intelligence translated our high-level prompt into quantifiable metrics and optimization objectives that guided its genetic algorithm. By leveraging our repository context through indexing and the provided script, Artemis gained deep understanding of our data preprocessing approach (we generated lags and had generated a lead on our target), and this analysis it integrated into the cross-correlation plot! Through evolving a single empty file, it generated dashboard variants that progressively improved on these metrics - evaluating components like visualization clarity, data relationship exploration capabilities, and cross-country comparison features - ready to display!
Dashboard generation with the EvoML Pipeline
If you have your ML project's pipeline on hand or if you, like us, are using EvoML to automate your data science workflow, you can also generate insightful dashboards with Artemis intelligence directly from your chosen model's pipeline, to aid model governance control, for instance. This is an example of how we have produced one such dashboard to demonstrate whether our model is compliant with both the EU AI Act and SR 11-7/OCC 2011-12 model risk management mandate. Reproducing this is easy:
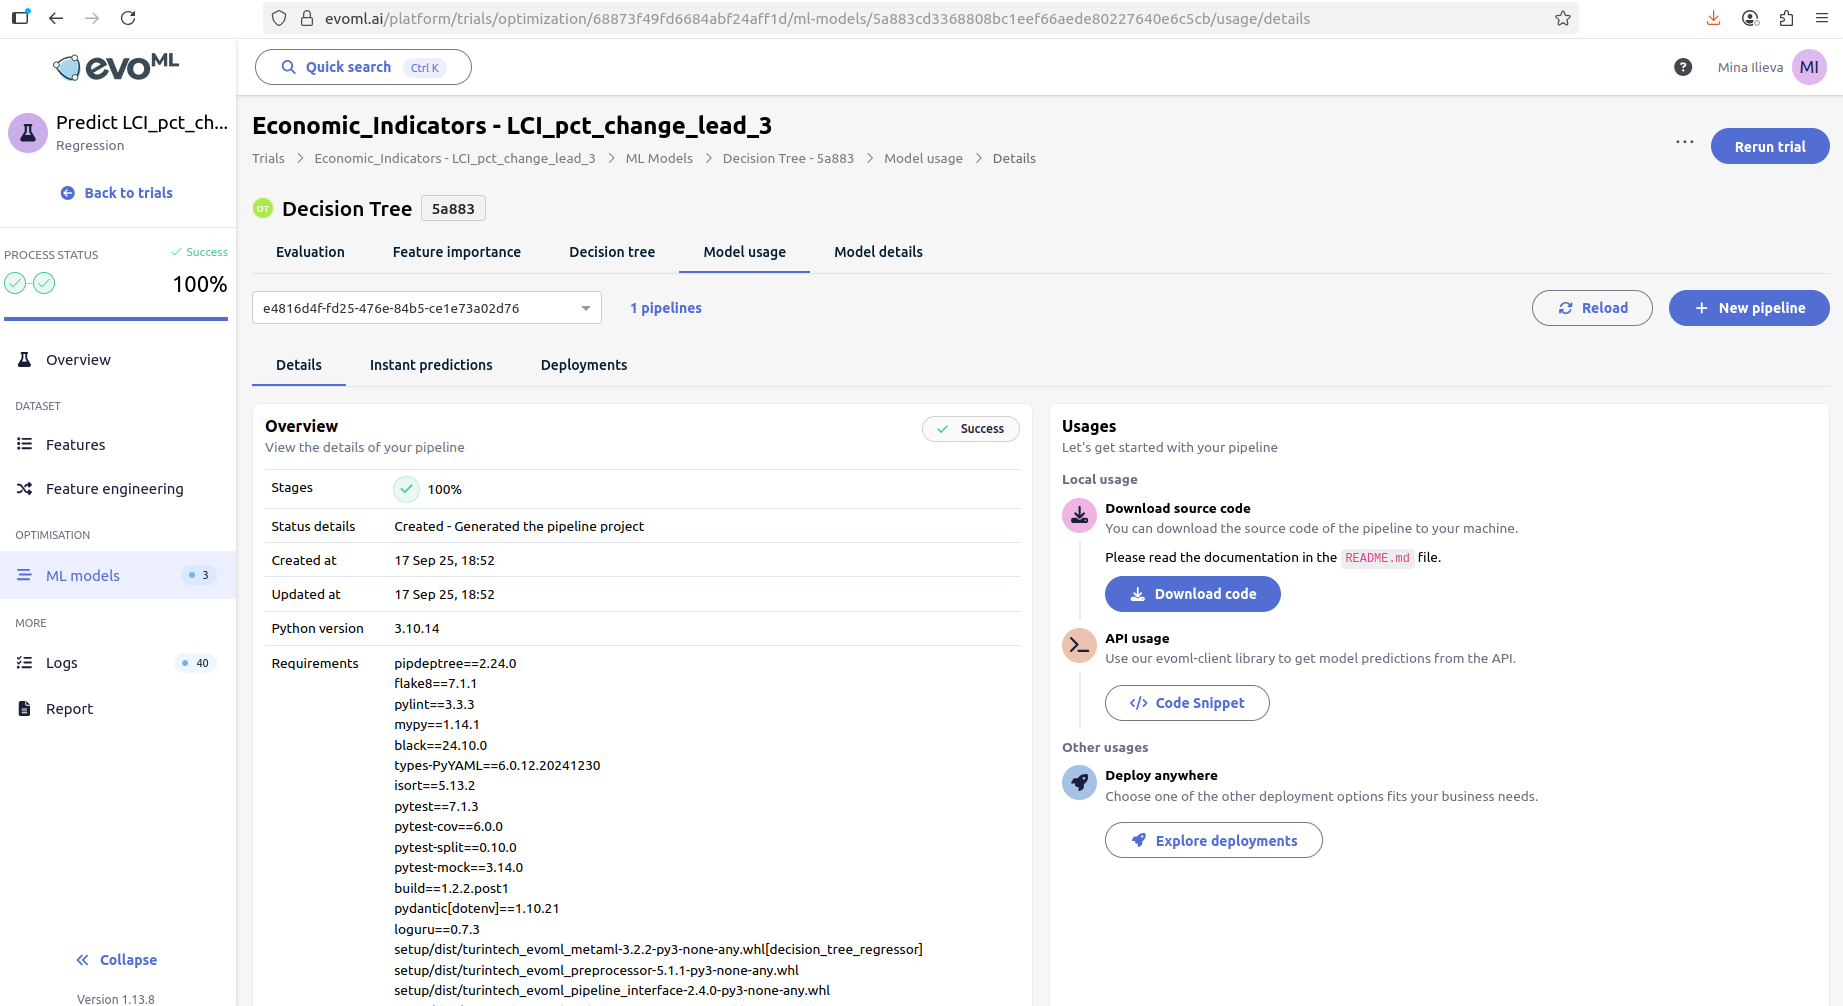
1. Download your chosen model's pipeline by clicking the 'Model usage' tab on EvoML. From there, click on Download code .
2. Extract and Configure Pipeline Environment
Extract the pipeline source code to your local development environment.
-
Create a new empty Streamlit file (.py) which will serve as the template for Artemis's evolutionary dashboard generation process.
-
Generate a comprehensive pipeline architecture documentation (Artemis.md) that defines the functional purpose of each component. Tailor this document to your own purposes, you could describe the following:
- Detailed component topology and interactions
- Infrastructure deployment targets (e.g. AWS, GCP, on-prem)
- Data flow specifications
- Migration requirements and timelines
- Integration touchpoints with external systems
- Security and compliance considerations
-
Update the pipeline's dependency configuration in pyproject.toml to include Streamlit and any additional visualization or data processing libraries required for your dashboard implementation. Then compress again.
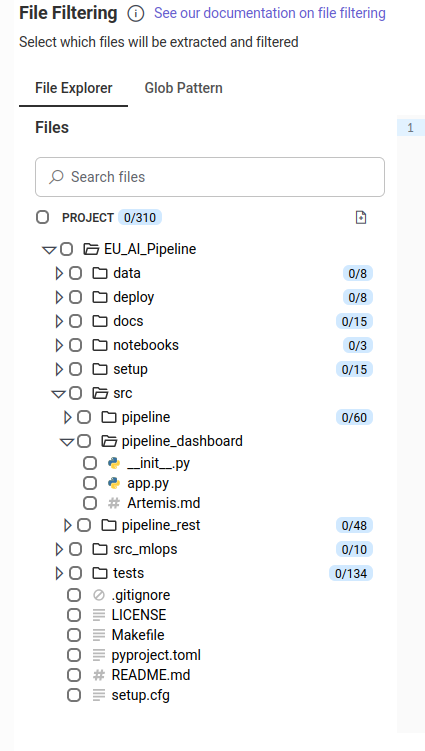
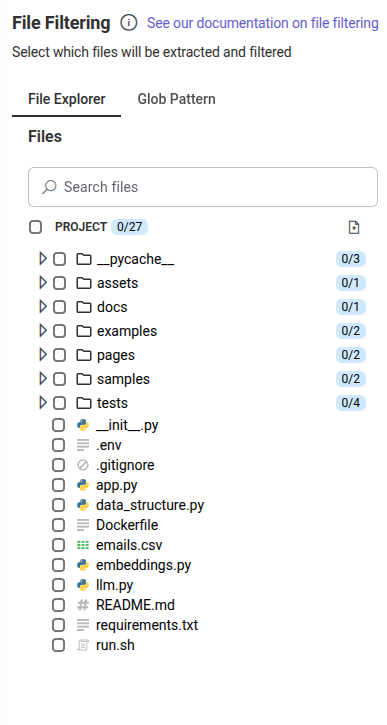
3. Upload your .zip file within Artemis. Our project looked like this:
4. Index your project. This will help Artemis form a high-dimensional representation of your codebase.
5. Simply start prompting!
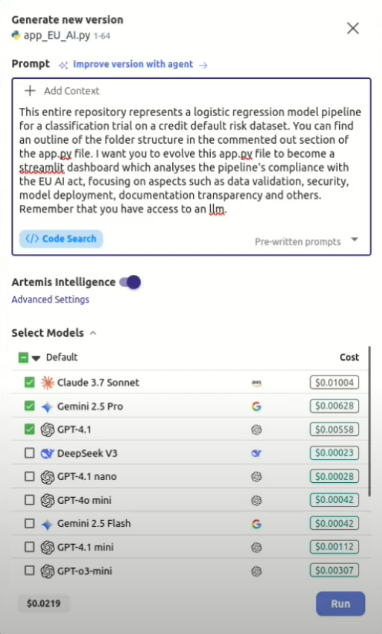
This is the prompt we supplied Artemis with when generating our compliance dashboard. We generated 15 versions with Artemis intelligence, and did not use a runner to compile our code during the process, but you can do so to obtain more control over version generations:
6. Final dashboard
This is the landing page of the best version generated by Artemis:
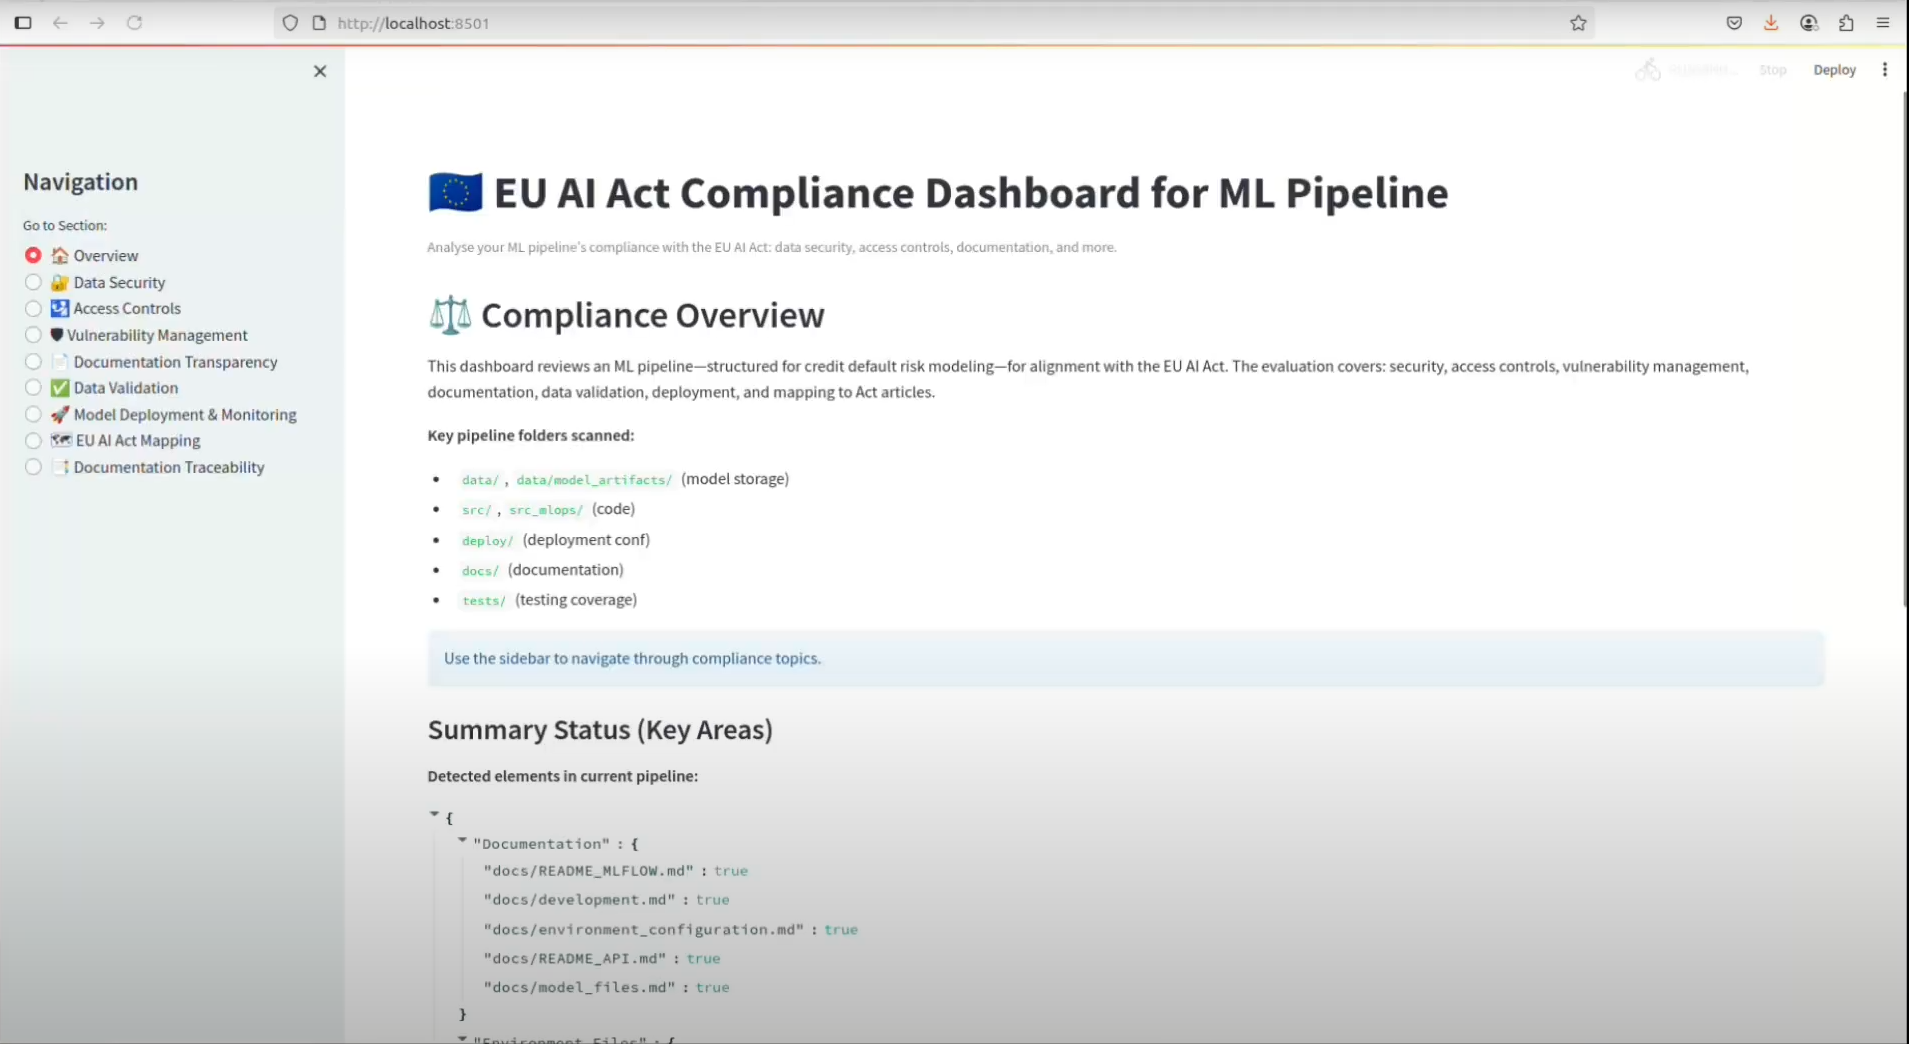
This dashboard essentially represented a compliance-readiness snapshot of our ML pipeline, aggregating pipeline structure evidence into eight pillars and an overview of all, aligned to EU AI Act obligations. Since model governance requirements vary across organizations, you can continue refining Artemis's generated versions to better match your specific compliance needs, by clicking on the + button on the right handside of the version template you like.
7. Dynamic dashboard evolution.
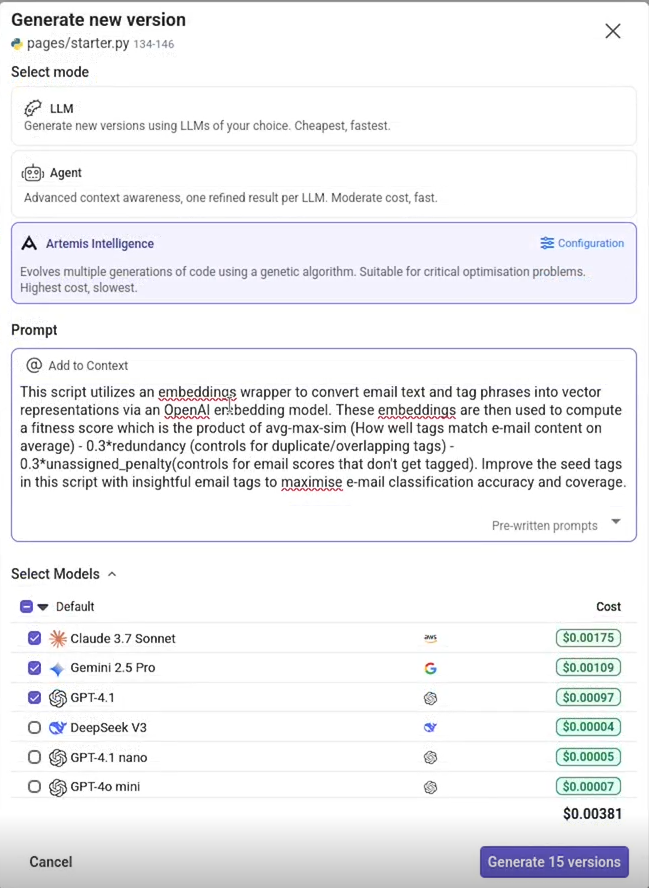
Artemis is not only a tool that can be used to build and customise dashboards, but can also be used to further optimise their components, to meet specific KPIs. As a final example, we describe a real-world use case that demonstrates this capability. Here, our evolutionary algorithm acts as a classifier, assigning instant novel categories to an auto-email tagging system, and will aim at increasing a fitness score, representative of the overall alignment between emails and the tags generated by Artemis (see score calculation below).
4.1. Prerequisites
Your OPENAI API KEY.
4.1. Project set-up
For this project, we uploaded a Streamlit dashboarding template, with the following crucial components for reproducibility:
-
app.py – the entry point of our Streamlit app.
-
./pages – a directory containing Python scripts that Streamlit automatically renders as separate pages in the multi-page application. We placed the script we will be evolving within this directory
-
emails.csv – a simulated customer support e-mail dataset, consisting of 200 samples, each represented by features such as subject line, the email body content, the tag, the customer tier, etc.
-
data_structure.py – a script to print a summary of our dataframe’s column characteristics to Artemis for context (see first example above).
-
embeddings.py – contains a wrapper around the OpenAI model and initializes a vector database storage (ChromaDB).
-
llm.py – a wrapper to access the OpenAI Software development kit and thereby enable API calls. We used OpenaAI’s text embedding-3-small to generate embeddings for our clustering/unsupervised classification task.
Standard project config files.
4.2. Project build
To compile and validate the solution variants generated by Artemis, we set up our project build in the following way:
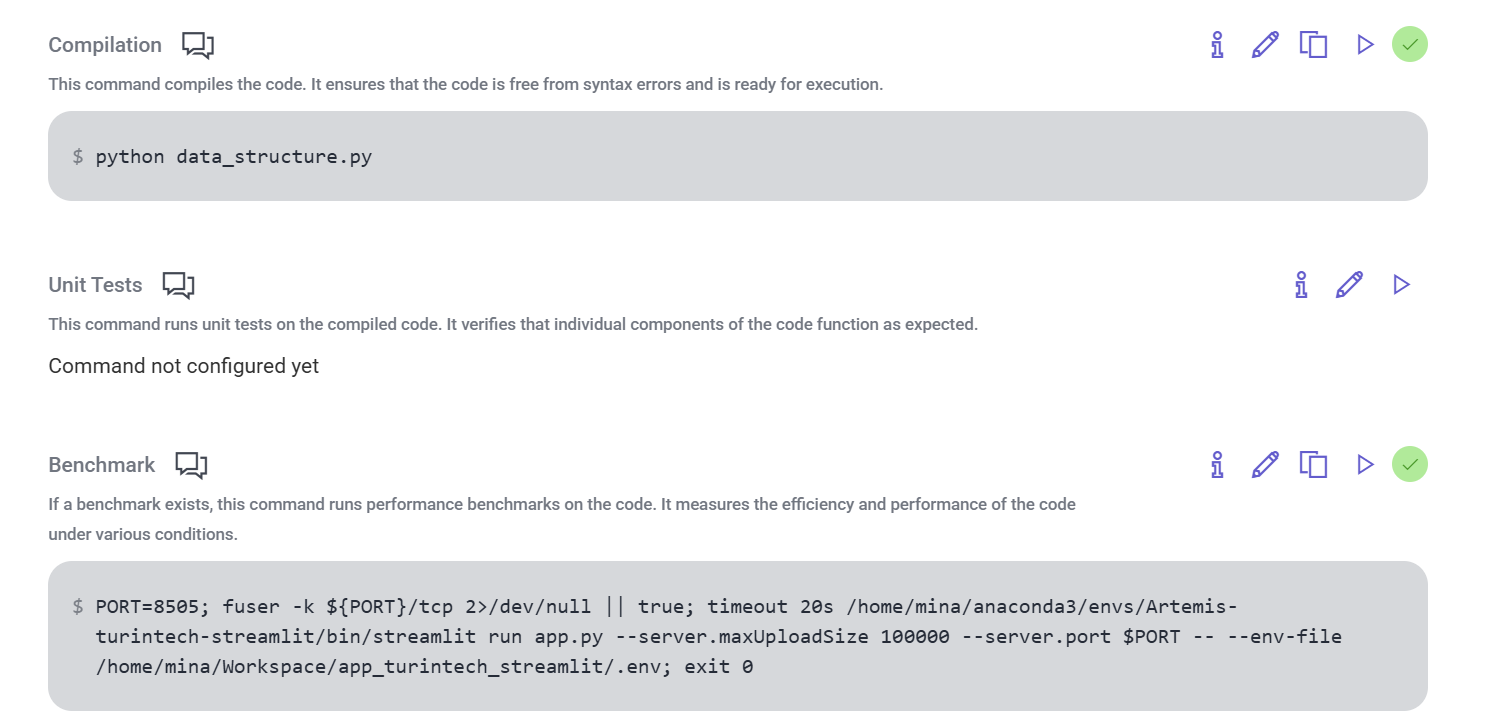
This set-up is similar to the one utilised for first dashboard generation demo. We run this script to aid Artemis in obtaining context for our dataframe. We invoke the Streamlit runtime, which executes our script and serves the application in a browser each time we run a validation of the code, as we also provide the path to our environment file, containing our OPENAI credentials locally.
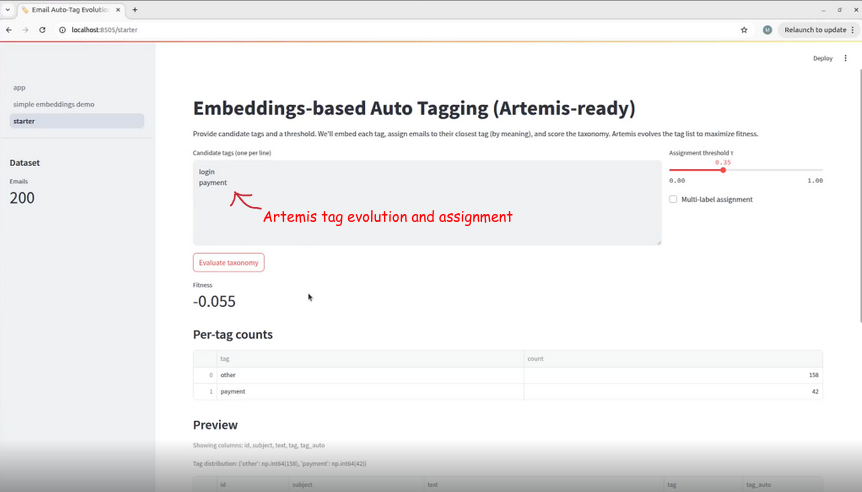
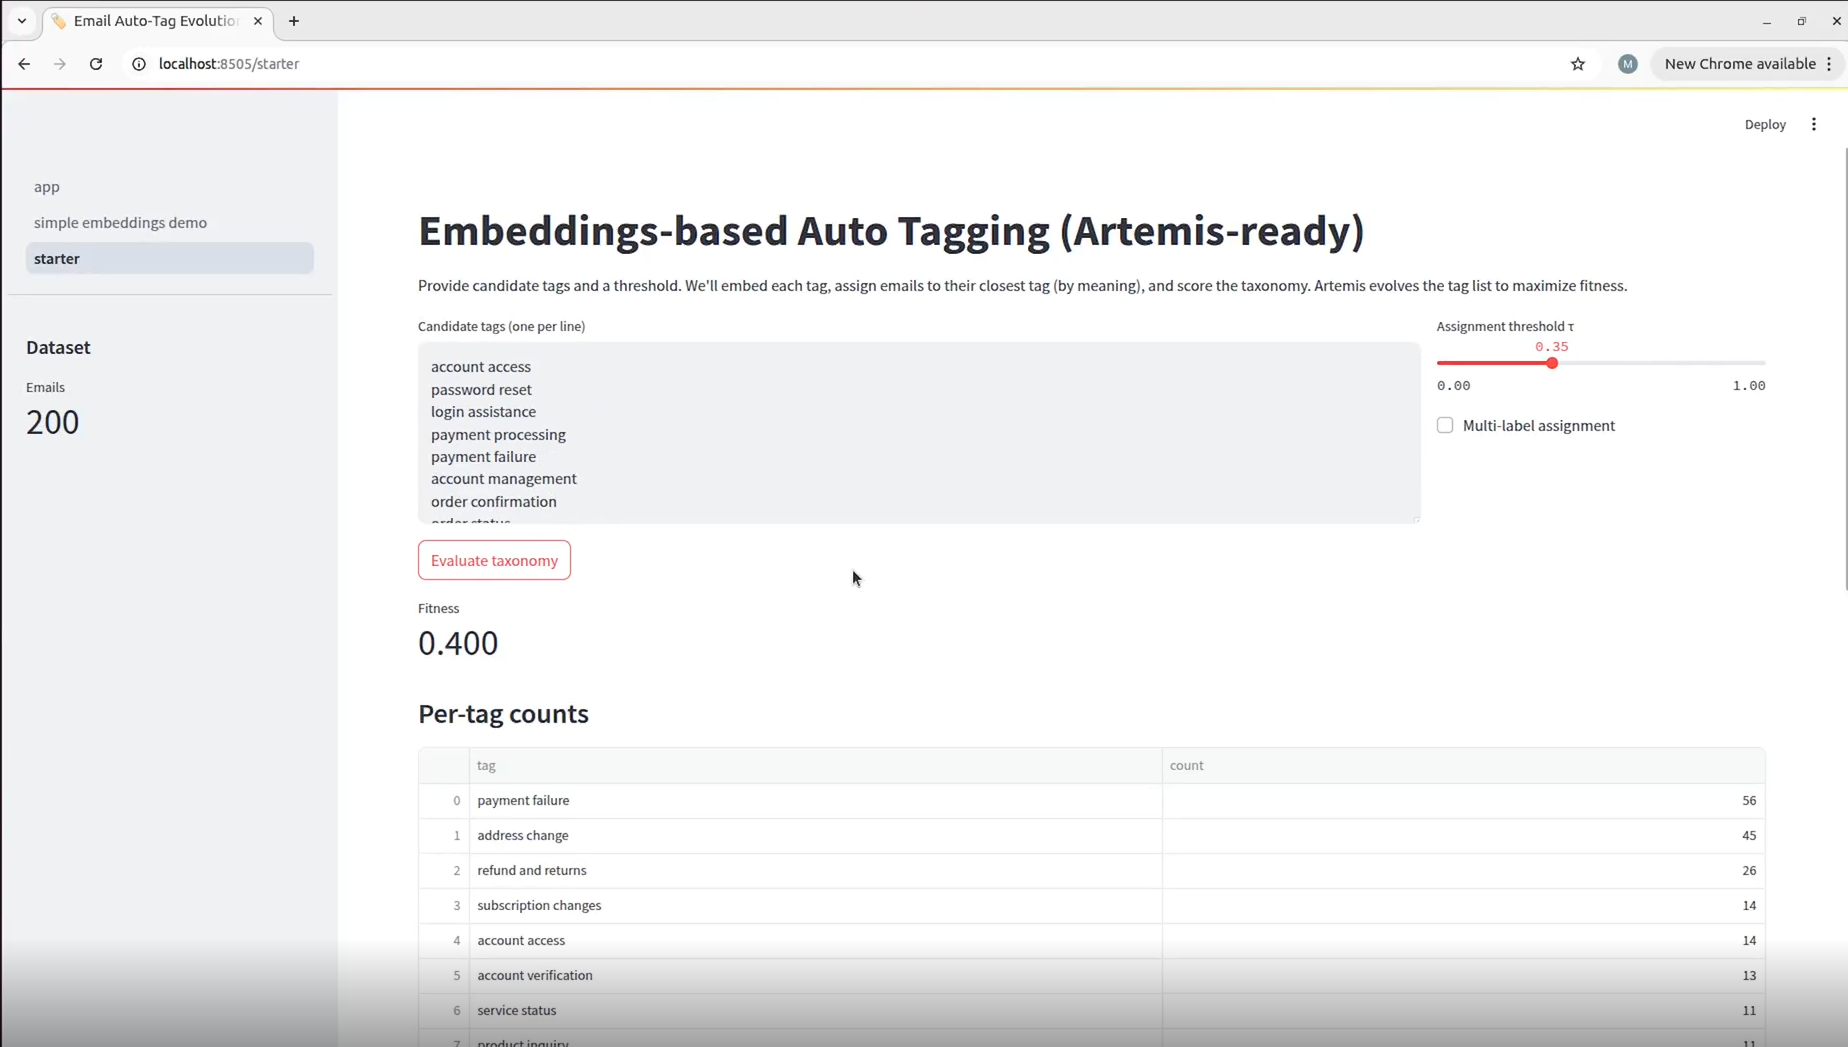
This snapshot represents the initial state of the page to be evolved by Artemis, as generated by the script we would be evolving. Here, we initialized a baseline set of candidate input tags. These are the tags Artemis would be asked to dynamically assign, when we run our recommendation trial. When the user triggers the Generate Taxonomy process, these tags are embedded and matched by similarity to the tag list within the email dataset, enabling automated assignment within a dataframe.
The assignment theshold τ ∈ [0,1] is a similarity cutoff parameter that determines when an e-mail should be assigned to a candidate tag versus being classified or unassigned as 'other'. We set τ to 0.35 to ensure semantic flexibility and high recall for tag assignment.
4.3. Script evolution
The script behind this Streamlit interface is the subject of evolution. It implements a sequential data-processing pipeline: it first loads the dataset, then performs feature engineering by concatenating the e-mail subject and body into a unified text column. The concatenated text is subsequently vectorised via our embeddings wrapper module, which interfaces with OpenAI's embedding model. In parallel, the script generates embeddings for the candidate tags. We then compute cosine similarity as the dot product of the resulting (normalised) vectors. This similarity score constitutes the basis for the fitness function that Artemis optimises:
$Fitness = avg_max_similarity - 0.3 \times redundancy - 0.3 \times unassigned_rate$
Where:
- avg_max_similarity - the average across all 200 e-mails' individual maximum similarity score across all tags.
- redundancy - the average pairwise similarity between tags
- unassigned_rate - Fraction of e-mails where max_similarity < τ (threshold), penalising tag sets that leave many e-mails unclassified.
The key mechanism in this setup is that, during each validation, the metric values for this function are printed to the logs. Our genetic algorithm's objective was therefore to increase this fitness score by dynamically assigning novel e-mail tags — and this is exactly what we asked it to do:
To initiate the evolutionary process, we simply triggered the taxonomy evaluation function through the dashboard interface, each time a variant was validated by Artemis, which calculated the fitness scores and drove the tag assignment optimisation.
4.3. Results
Artemis successfully optimized the email classification system, improving the fitness score from -0.055 to 0.400, by creating meaningful, granular tags while ensuring comprehensive email coverage, and provided a highly efficient solution for automated email categorization.